Free Access
Fig. 5.
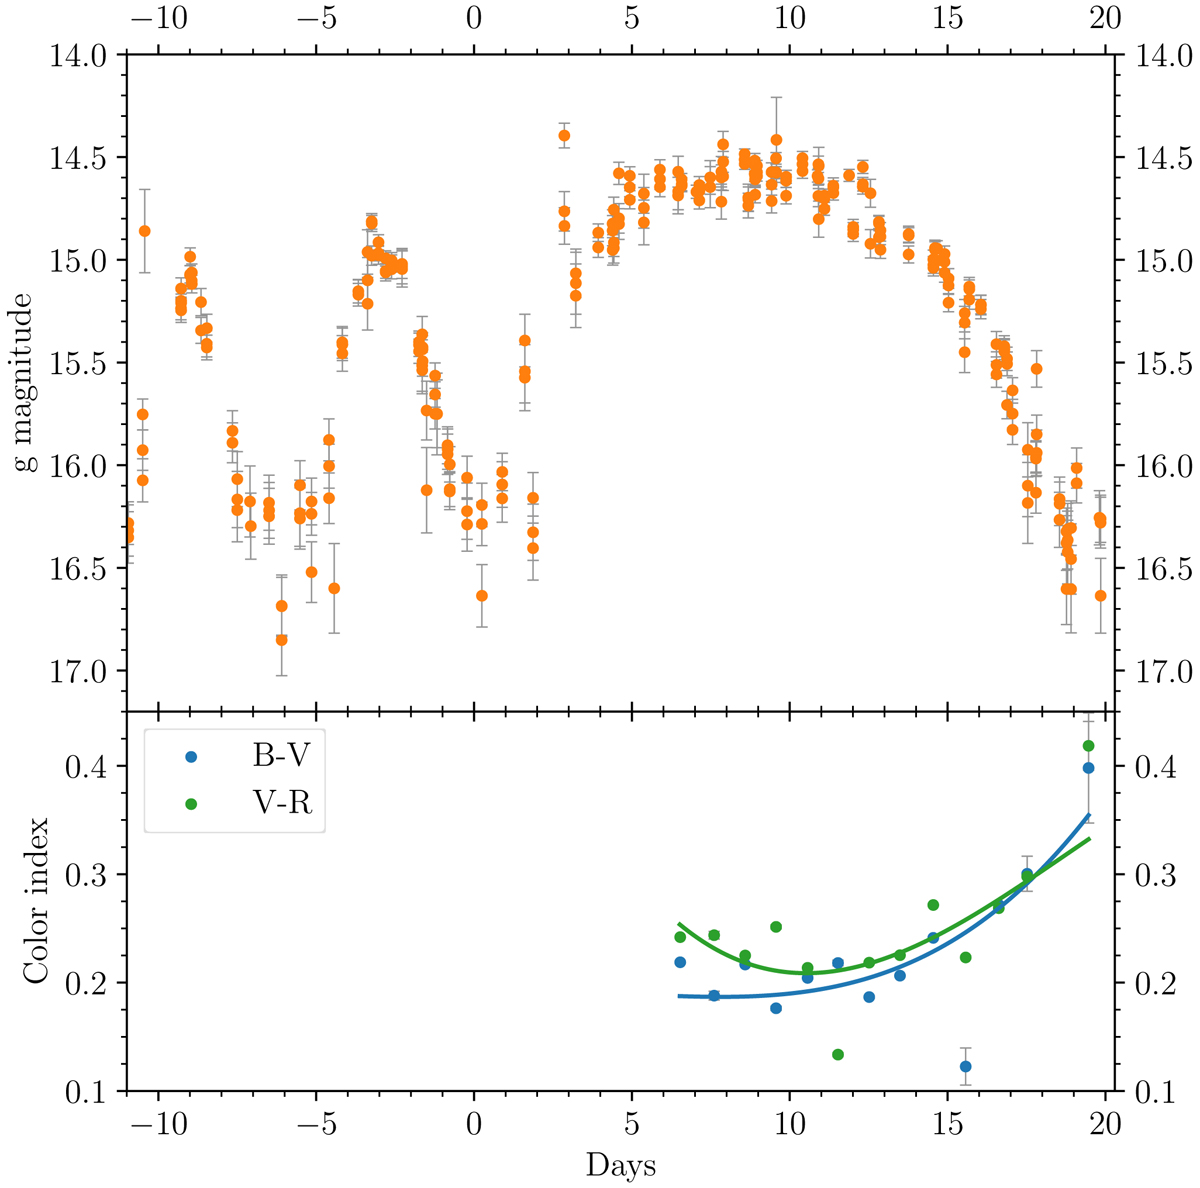
Zoom of the average g-band light curve centred on a superoutburst together with two preceding normal outbursts (top; see the description in the text). Evolution of colour indices B − V (blue dots) and V − R (green dots) during the superoutburst of the cycle 22 (bottom).
Current usage metrics show cumulative count of Article Views (full-text article views including HTML views, PDF and ePub downloads, according to the available data) and Abstracts Views on Vision4Press platform.
Data correspond to usage on the plateform after 2015. The current usage metrics is available 48-96 hours after online publication and is updated daily on week days.
Initial download of the metrics may take a while.