Free Access
Fig. 4.
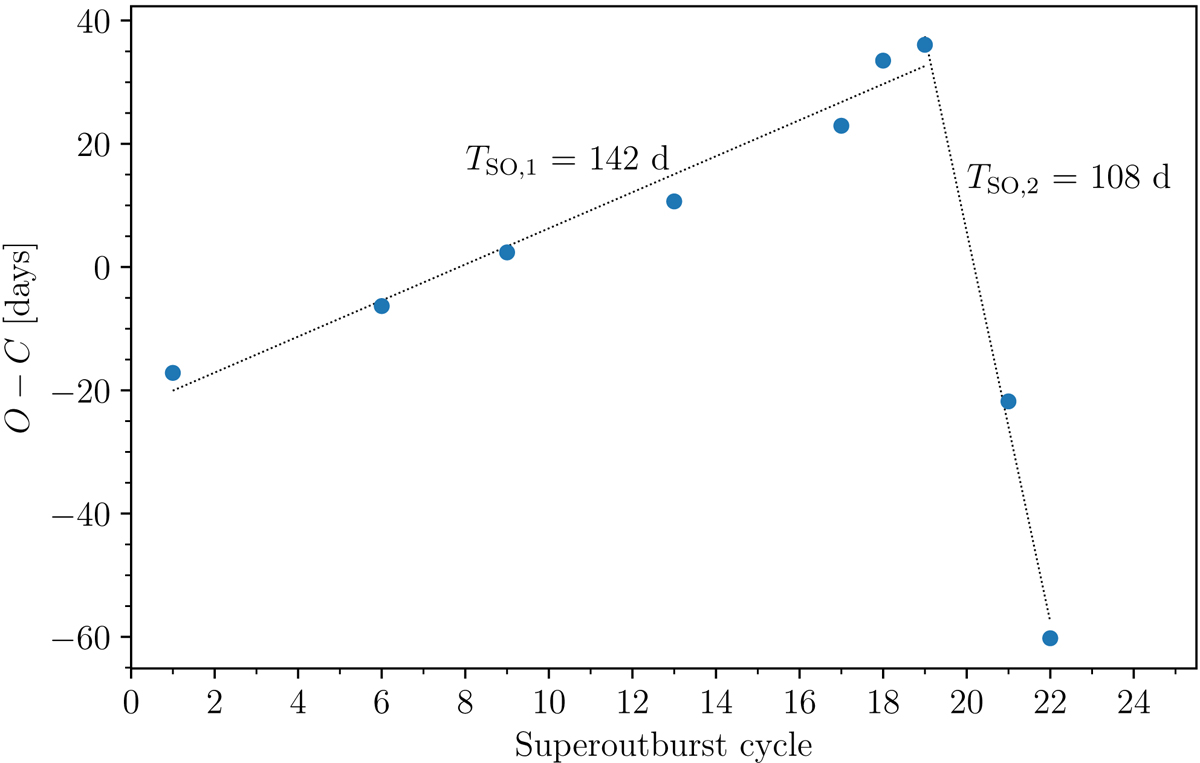
Observed minus calculated (O − C) diagram for superoutburst occurrences. The expected moments of superoutbursts were computed accepting a recurrent time of TSO = 140 days. Linear fits for intervals of 1–19 and 19–22 cycles are shown. The calculated average times between superoutbursts are marked for each interval.
Current usage metrics show cumulative count of Article Views (full-text article views including HTML views, PDF and ePub downloads, according to the available data) and Abstracts Views on Vision4Press platform.
Data correspond to usage on the plateform after 2015. The current usage metrics is available 48-96 hours after online publication and is updated daily on week days.
Initial download of the metrics may take a while.