Free Access
Fig. 12.
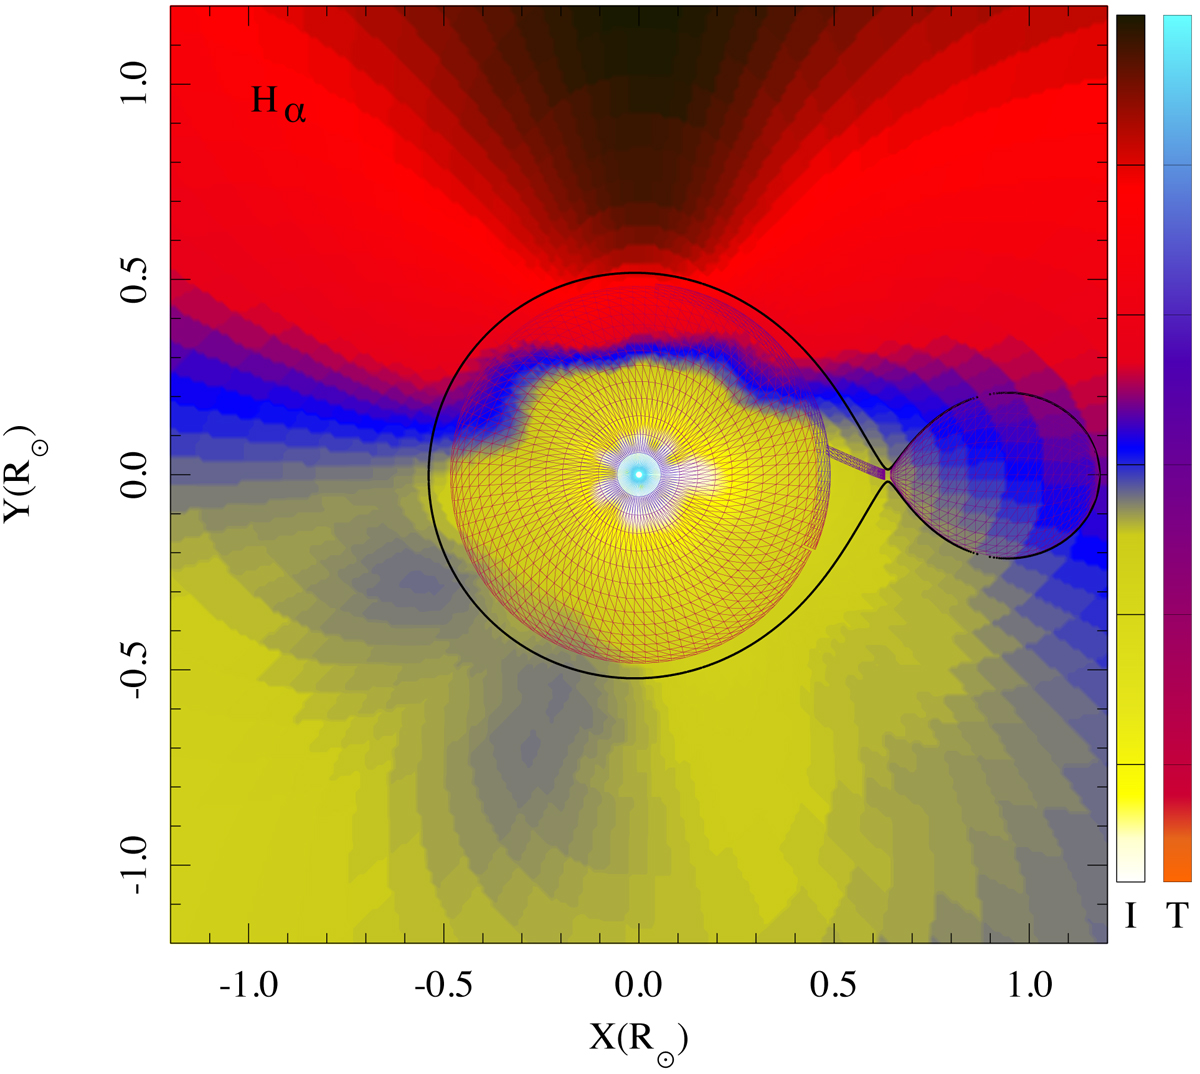
Brightness distribution “I” transformed from the Doppler map of the Hα emission line to the XY plane of the system together with the geometrical view “T” of the system in effective temperatures (1000–10 000 K), as follows from the light-curve modelling.
Current usage metrics show cumulative count of Article Views (full-text article views including HTML views, PDF and ePub downloads, according to the available data) and Abstracts Views on Vision4Press platform.
Data correspond to usage on the plateform after 2015. The current usage metrics is available 48-96 hours after online publication and is updated daily on week days.
Initial download of the metrics may take a while.