Fig. 10.
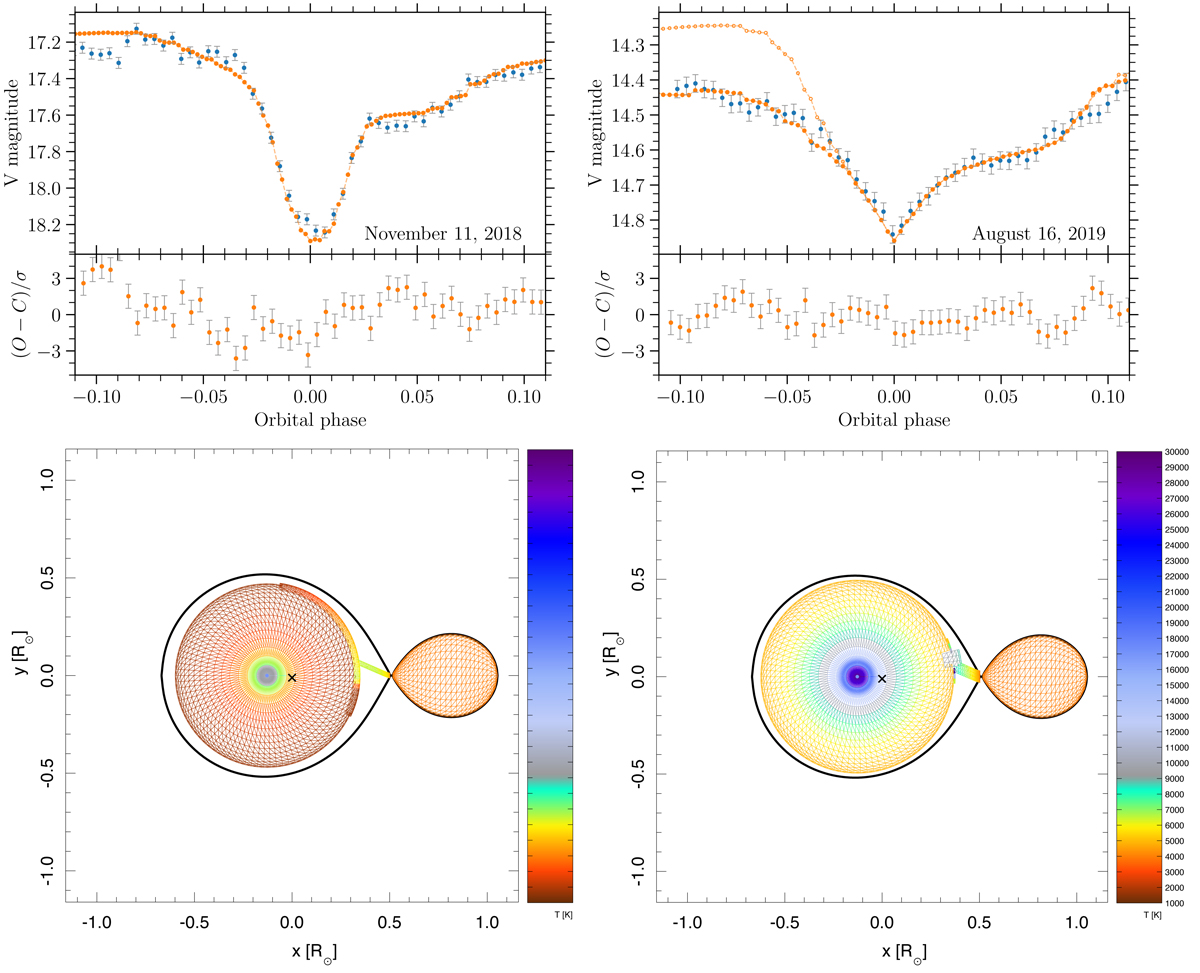
Results of the light curve fit of CzeV404 Her eclipses in quiescence (top left) and in superoutburst (top right). The blue points show the observational data presented in Fig. 7. The orange points mark the modelling light curves corresponding to the best fits. The O − C residuals for the fits are given. Models of CzeV404 Her in quiescence (bottom left) and in outburst (bottom right). The colours mark the effective temperature of the system elements (right bar).
Current usage metrics show cumulative count of Article Views (full-text article views including HTML views, PDF and ePub downloads, according to the available data) and Abstracts Views on Vision4Press platform.
Data correspond to usage on the plateform after 2015. The current usage metrics is available 48-96 hours after online publication and is updated daily on week days.
Initial download of the metrics may take a while.