Free Access
Fig. 6
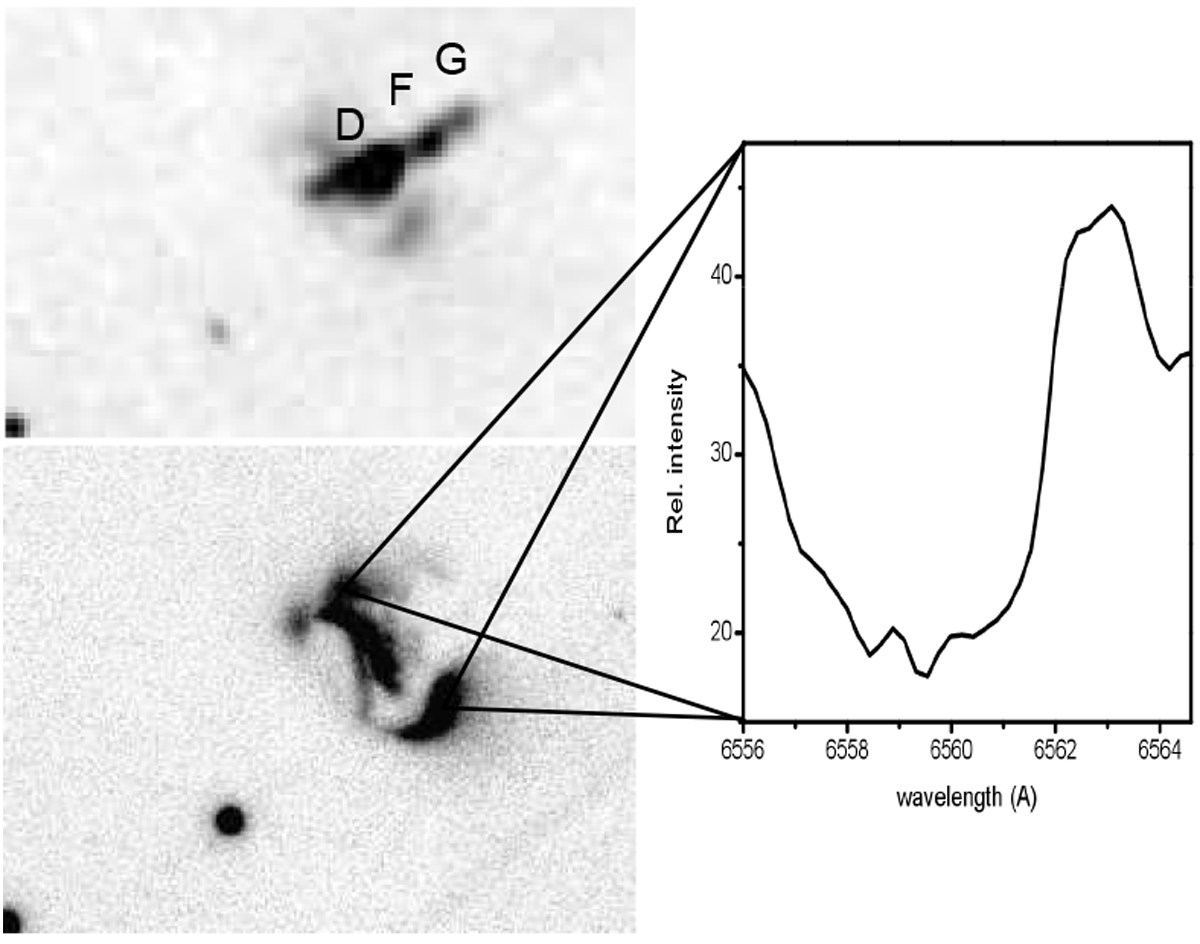
Integrated profile of the Hα line in the reflected light of the source of HH 83. The left side shows an enlarged image of the central part of HH 83 system in Hα emission (the integrated FP image from 2017, upper panel) and in i band (PanSTARRS survey, lower panel).
Current usage metrics show cumulative count of Article Views (full-text article views including HTML views, PDF and ePub downloads, according to the available data) and Abstracts Views on Vision4Press platform.
Data correspond to usage on the plateform after 2015. The current usage metrics is available 48-96 hours after online publication and is updated daily on week days.
Initial download of the metrics may take a while.