Free Access
Fig. 5.
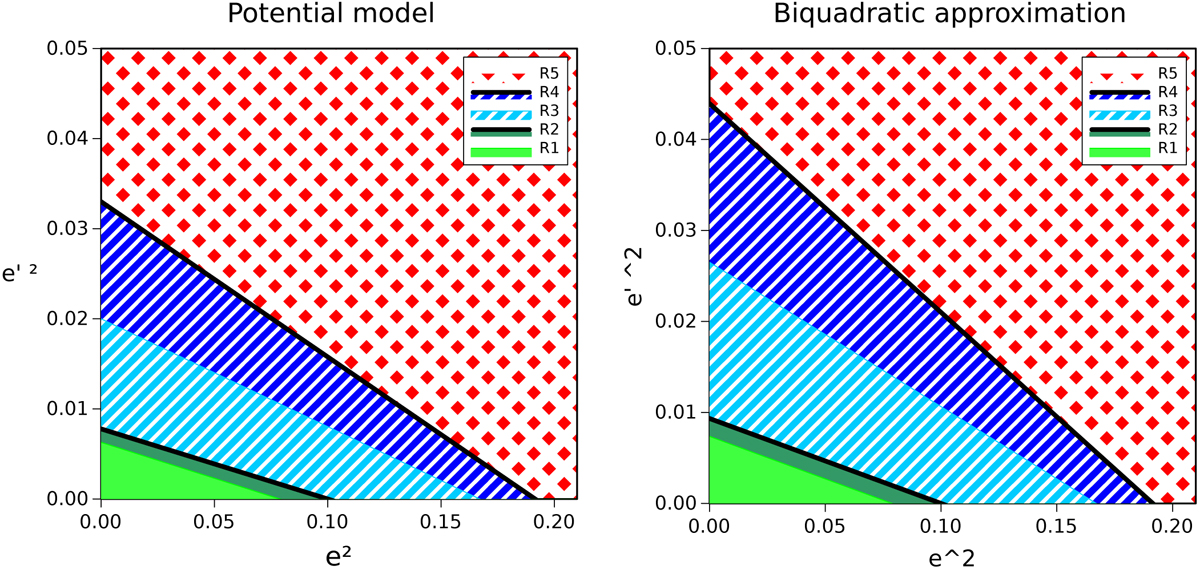
Triangular regions according to Table 1, for the current potential model (left) and for the biquadratic approximation (right). The complementary area is the halo (red).
Current usage metrics show cumulative count of Article Views (full-text article views including HTML views, PDF and ePub downloads, according to the available data) and Abstracts Views on Vision4Press platform.
Data correspond to usage on the plateform after 2015. The current usage metrics is available 48-96 hours after online publication and is updated daily on week days.
Initial download of the metrics may take a while.