Fig. 4.
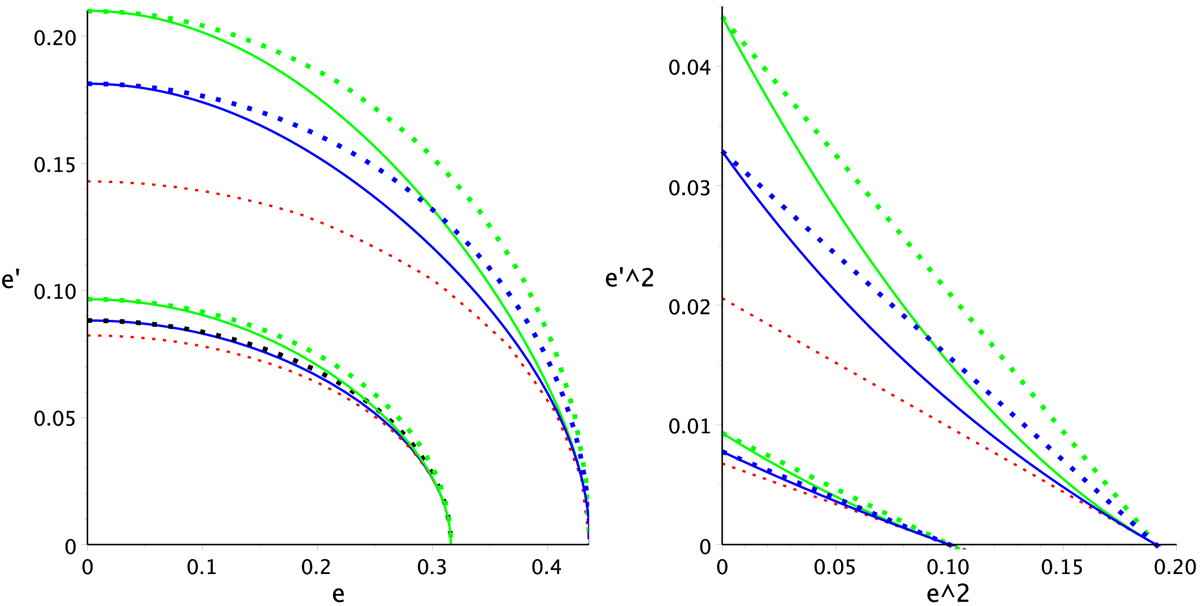
Quarter ellipses (left) defining the regions R2 (closer to the origin) and R4 (farther from the origin), according to the biquadratic fit (continuous green curves), potential model (continuous blue curves), and epicycle approach (dotted red curves). The dotted green and blue curves are the respective approximations from quarter ellipses. The same regions in terms of the squared eccentricities are displayed on the right.
Current usage metrics show cumulative count of Article Views (full-text article views including HTML views, PDF and ePub downloads, according to the available data) and Abstracts Views on Vision4Press platform.
Data correspond to usage on the plateform after 2015. The current usage metrics is available 48-96 hours after online publication and is updated daily on week days.
Initial download of the metrics may take a while.