Free Access
Fig. D.2.
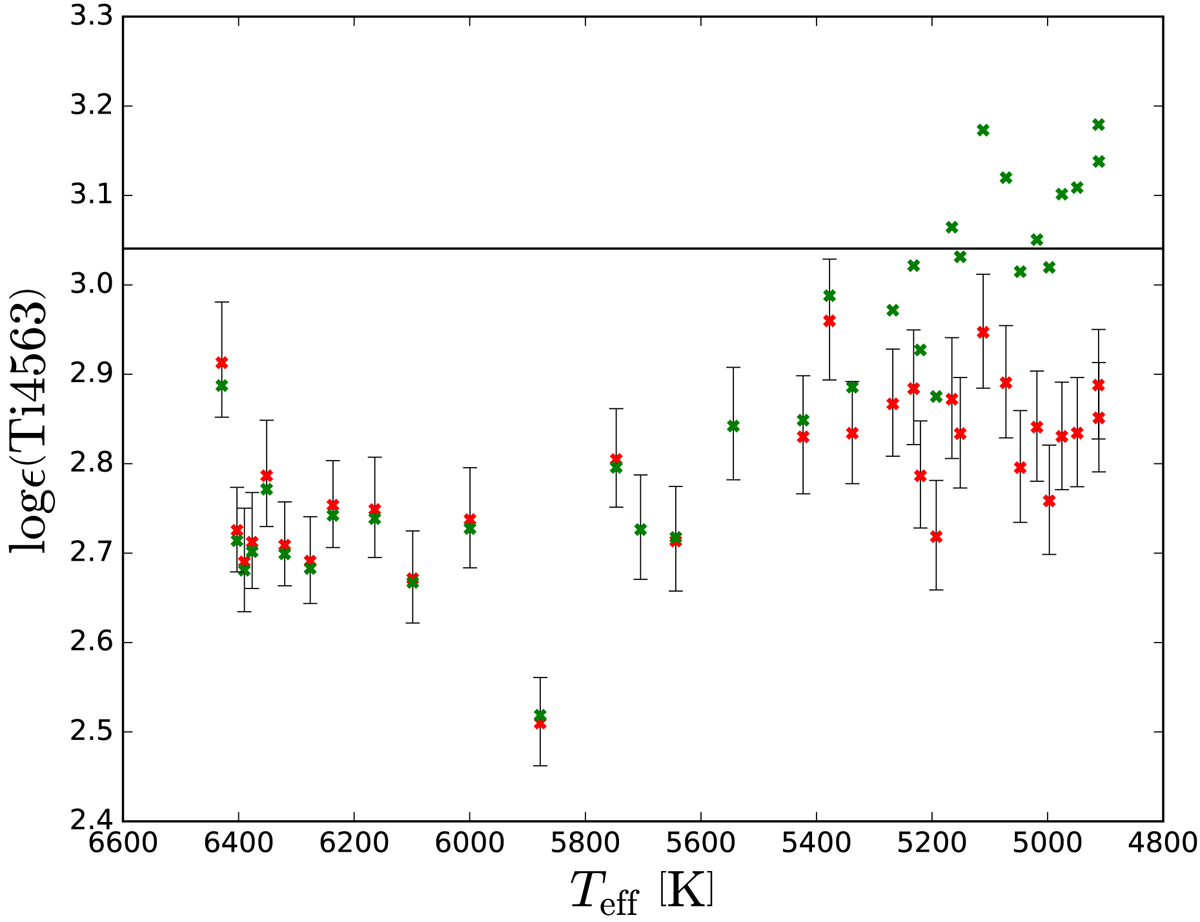
Derived abundances from the Ti4563 line. Red crosses show 1D LTE results and green crosses show 3D LTE results. Error bars denote the possible systematic error due to uncertainty in the continuum fitting. The horizontal line denotes the initial abundance assumed in the stellar evolution model.
Current usage metrics show cumulative count of Article Views (full-text article views including HTML views, PDF and ePub downloads, according to the available data) and Abstracts Views on Vision4Press platform.
Data correspond to usage on the plateform after 2015. The current usage metrics is available 48-96 hours after online publication and is updated daily on week days.
Initial download of the metrics may take a while.