Fig. 3.
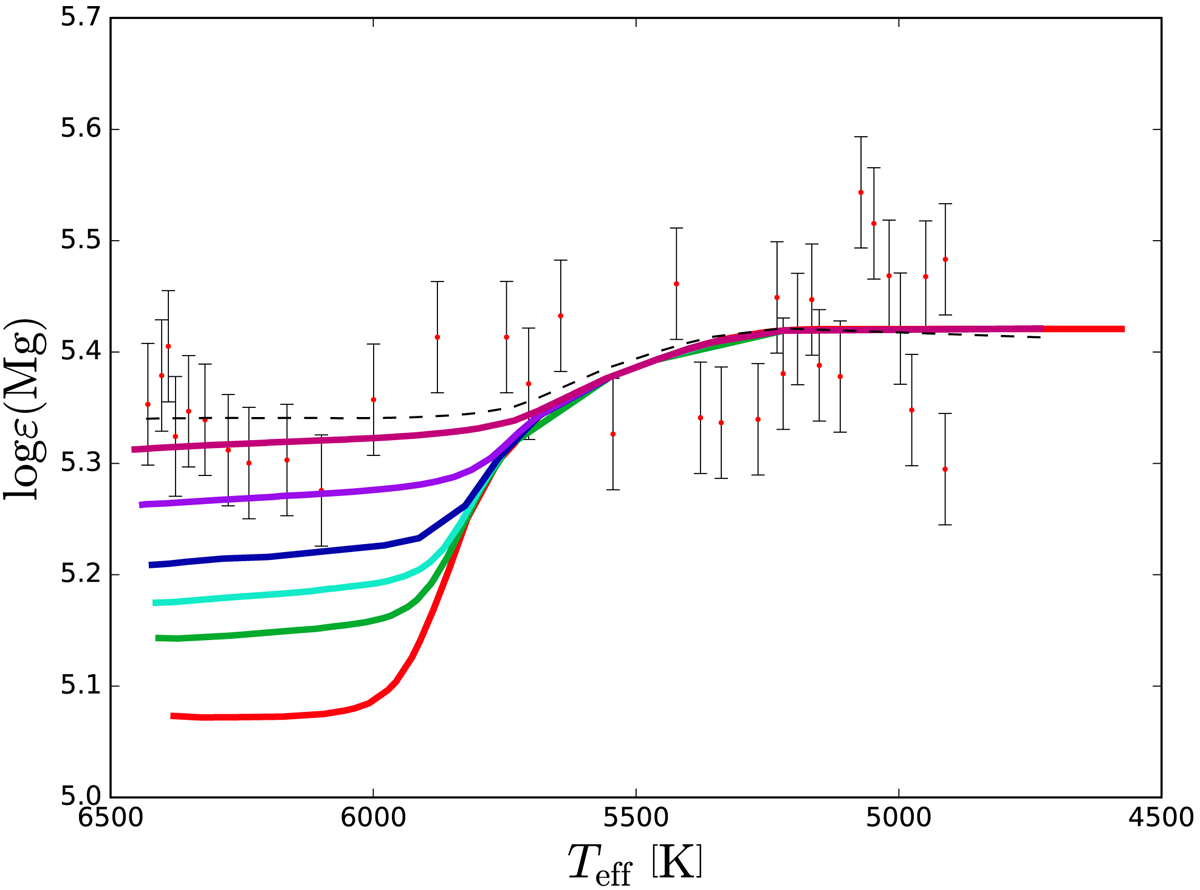
Model predictions and estimated abundances for the Mg4702 line. The red curve shows the abundance predictions from T5.8, the green those from T5.9, the light blue those from T5.95, the dark blue those from T6.0, the violet those from T6.09 and the magenta those from T6.2. Red dots denote estimated abundances for each group spectrum. The black error bars show the random component of the error. The dashed black curve shows our estimate of the true trend with the best-estimate of the systematic error added.
Current usage metrics show cumulative count of Article Views (full-text article views including HTML views, PDF and ePub downloads, according to the available data) and Abstracts Views on Vision4Press platform.
Data correspond to usage on the plateform after 2015. The current usage metrics is available 48-96 hours after online publication and is updated daily on week days.
Initial download of the metrics may take a while.