Fig. 1
![]() derived in this work as a function of
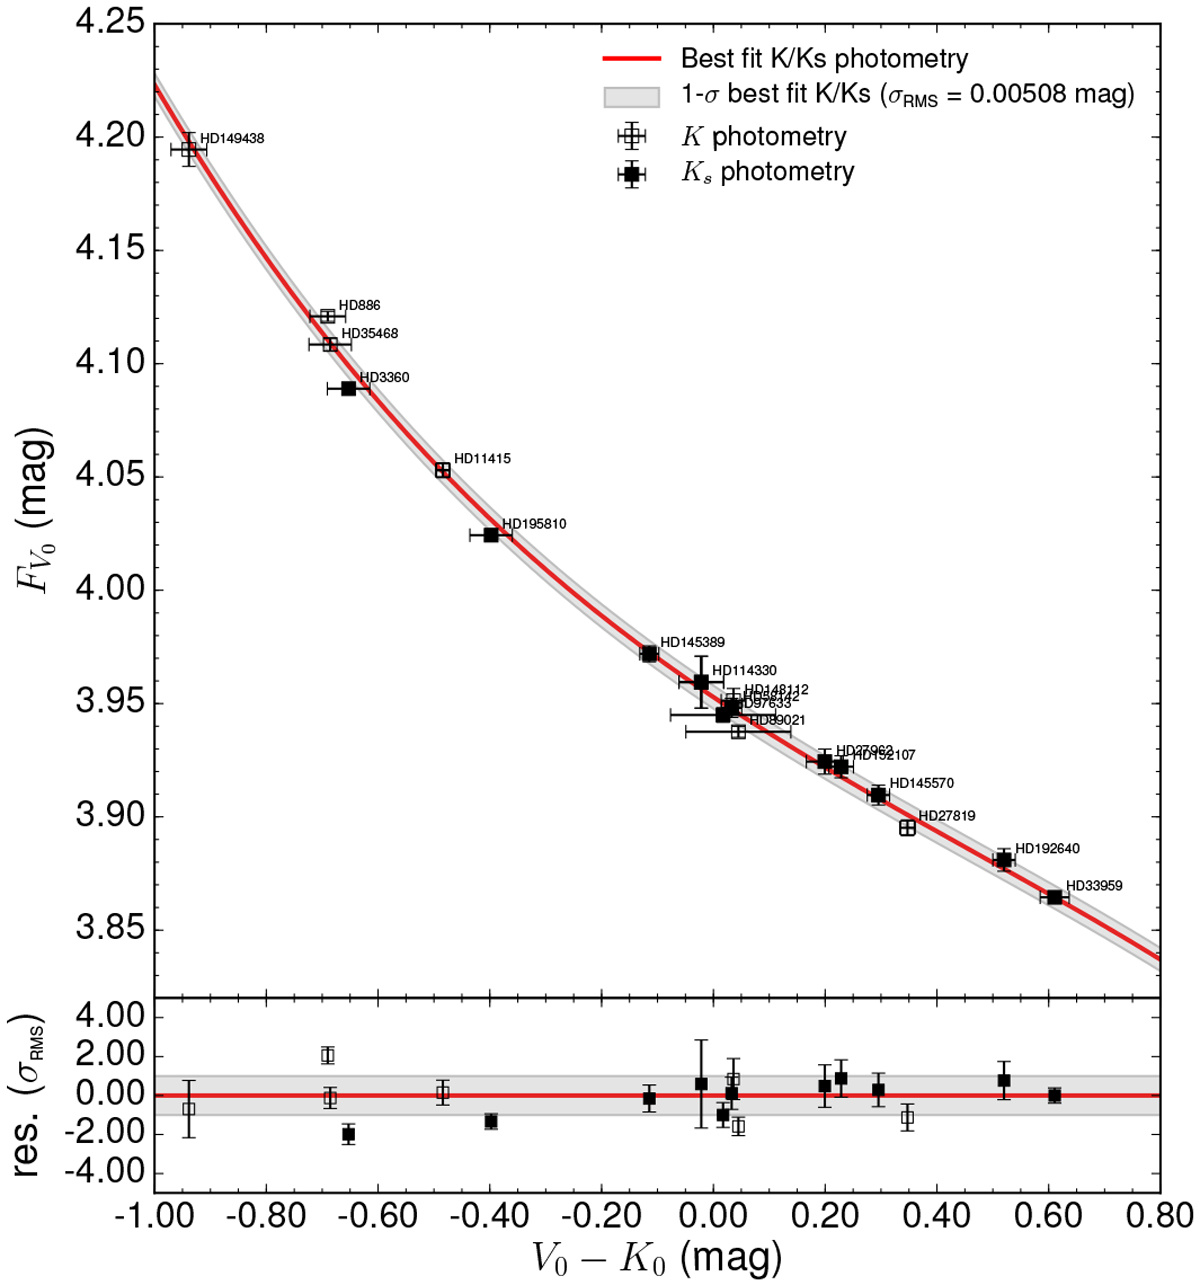
derived in this work as a function of ![]() . Empty squares are data with a K Johnson photometry, while filled squares are those with a Ks photometry.The third-order SBCR for early-type dwarfs is shown by the red solid line. The gray area denotes the RMS of the relation. The bottom panel presents the residual in units of the RMS of the relation. See Sect. 4 for a description of the fitting strategy.
. Empty squares are data with a K Johnson photometry, while filled squares are those with a Ks photometry.The third-order SBCR for early-type dwarfs is shown by the red solid line. The gray area denotes the RMS of the relation. The bottom panel presents the residual in units of the RMS of the relation. See Sect. 4 for a description of the fitting strategy.
Current usage metrics show cumulative count of Article Views (full-text article views including HTML views, PDF and ePub downloads, according to the available data) and Abstracts Views on Vision4Press platform.
Data correspond to usage on the plateform after 2015. The current usage metrics is available 48-96 hours after online publication and is updated daily on week days.
Initial download of the metrics may take a while.