Fig. 9.
Download original image
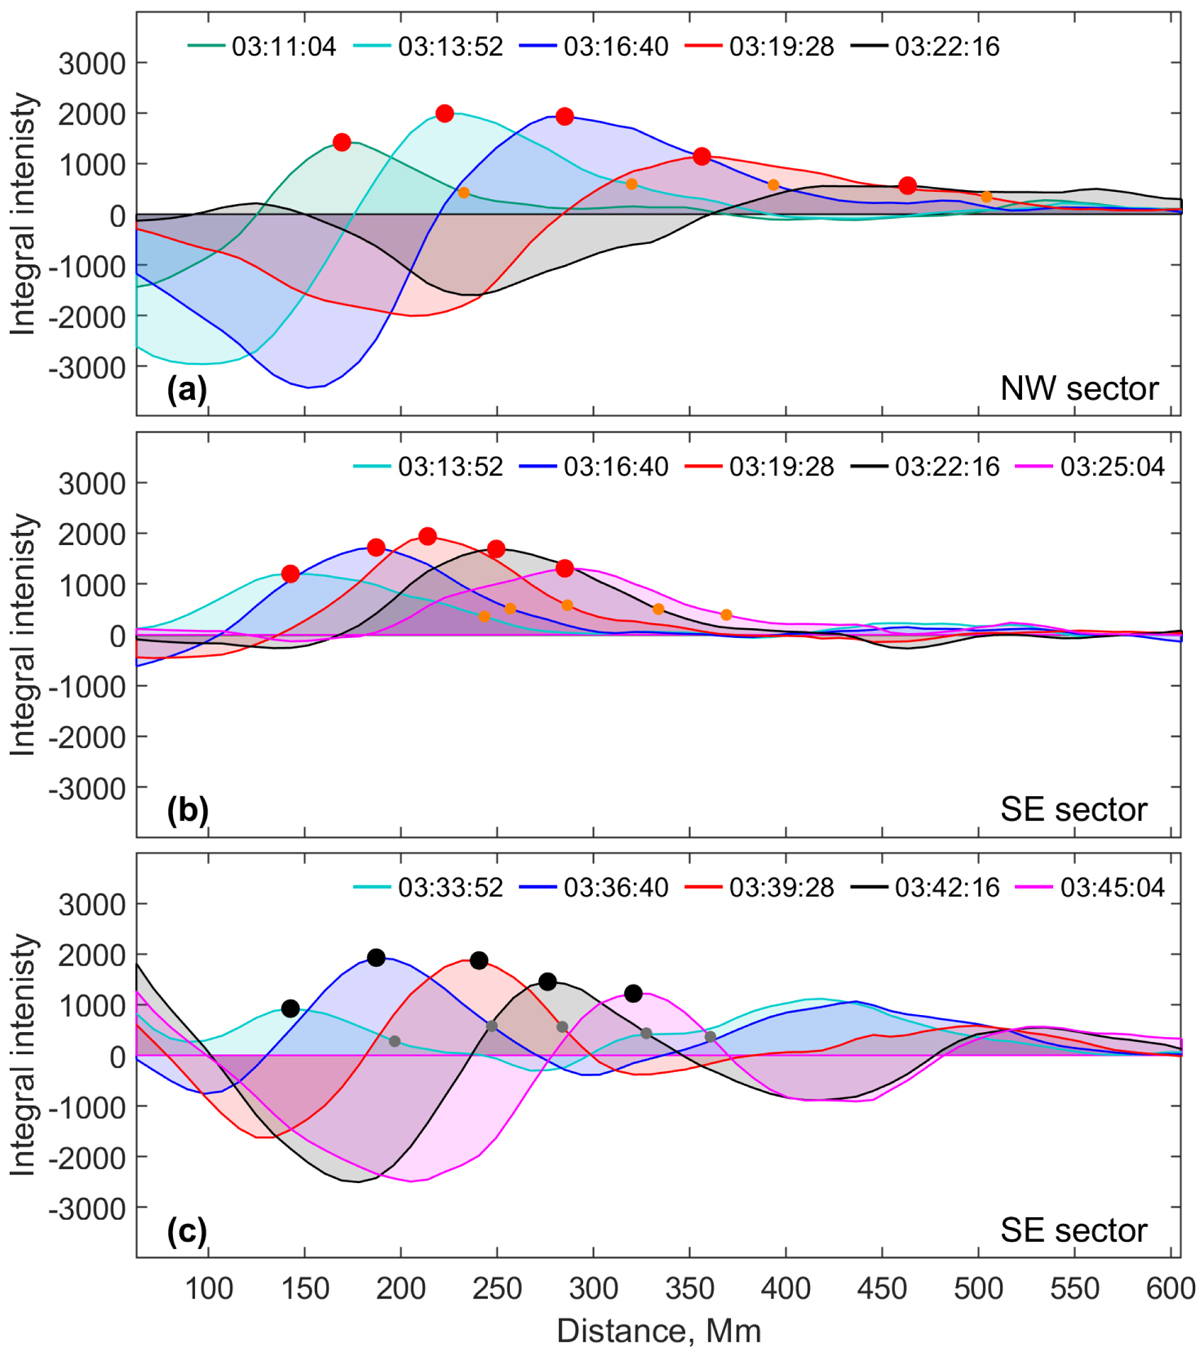
Intensity perturbation profiles illustrating the evolution and propagation of the EUV waves in different directions (see sectors plotted in Fig. 8): (a) first wave in NW sector, (b) first wave in SE sector, (c) second wave in SE sector. Big circles (red – first and black – second wave) mark the peak amplitude of each profile, small circles (orange – first and gray – second wave) mark the determined wavefront positions (extracted at 30% of the peak value) used for the EUV wave kinematics plotted in Fig. 10. A movie accompanying the figure is available online (movie5), showing the dynamics of the intensity perturbation profiles with a cadence of 24 s.
Current usage metrics show cumulative count of Article Views (full-text article views including HTML views, PDF and ePub downloads, according to the available data) and Abstracts Views on Vision4Press platform.
Data correspond to usage on the plateform after 2015. The current usage metrics is available 48-96 hours after online publication and is updated daily on week days.
Initial download of the metrics may take a while.