Fig. 7.
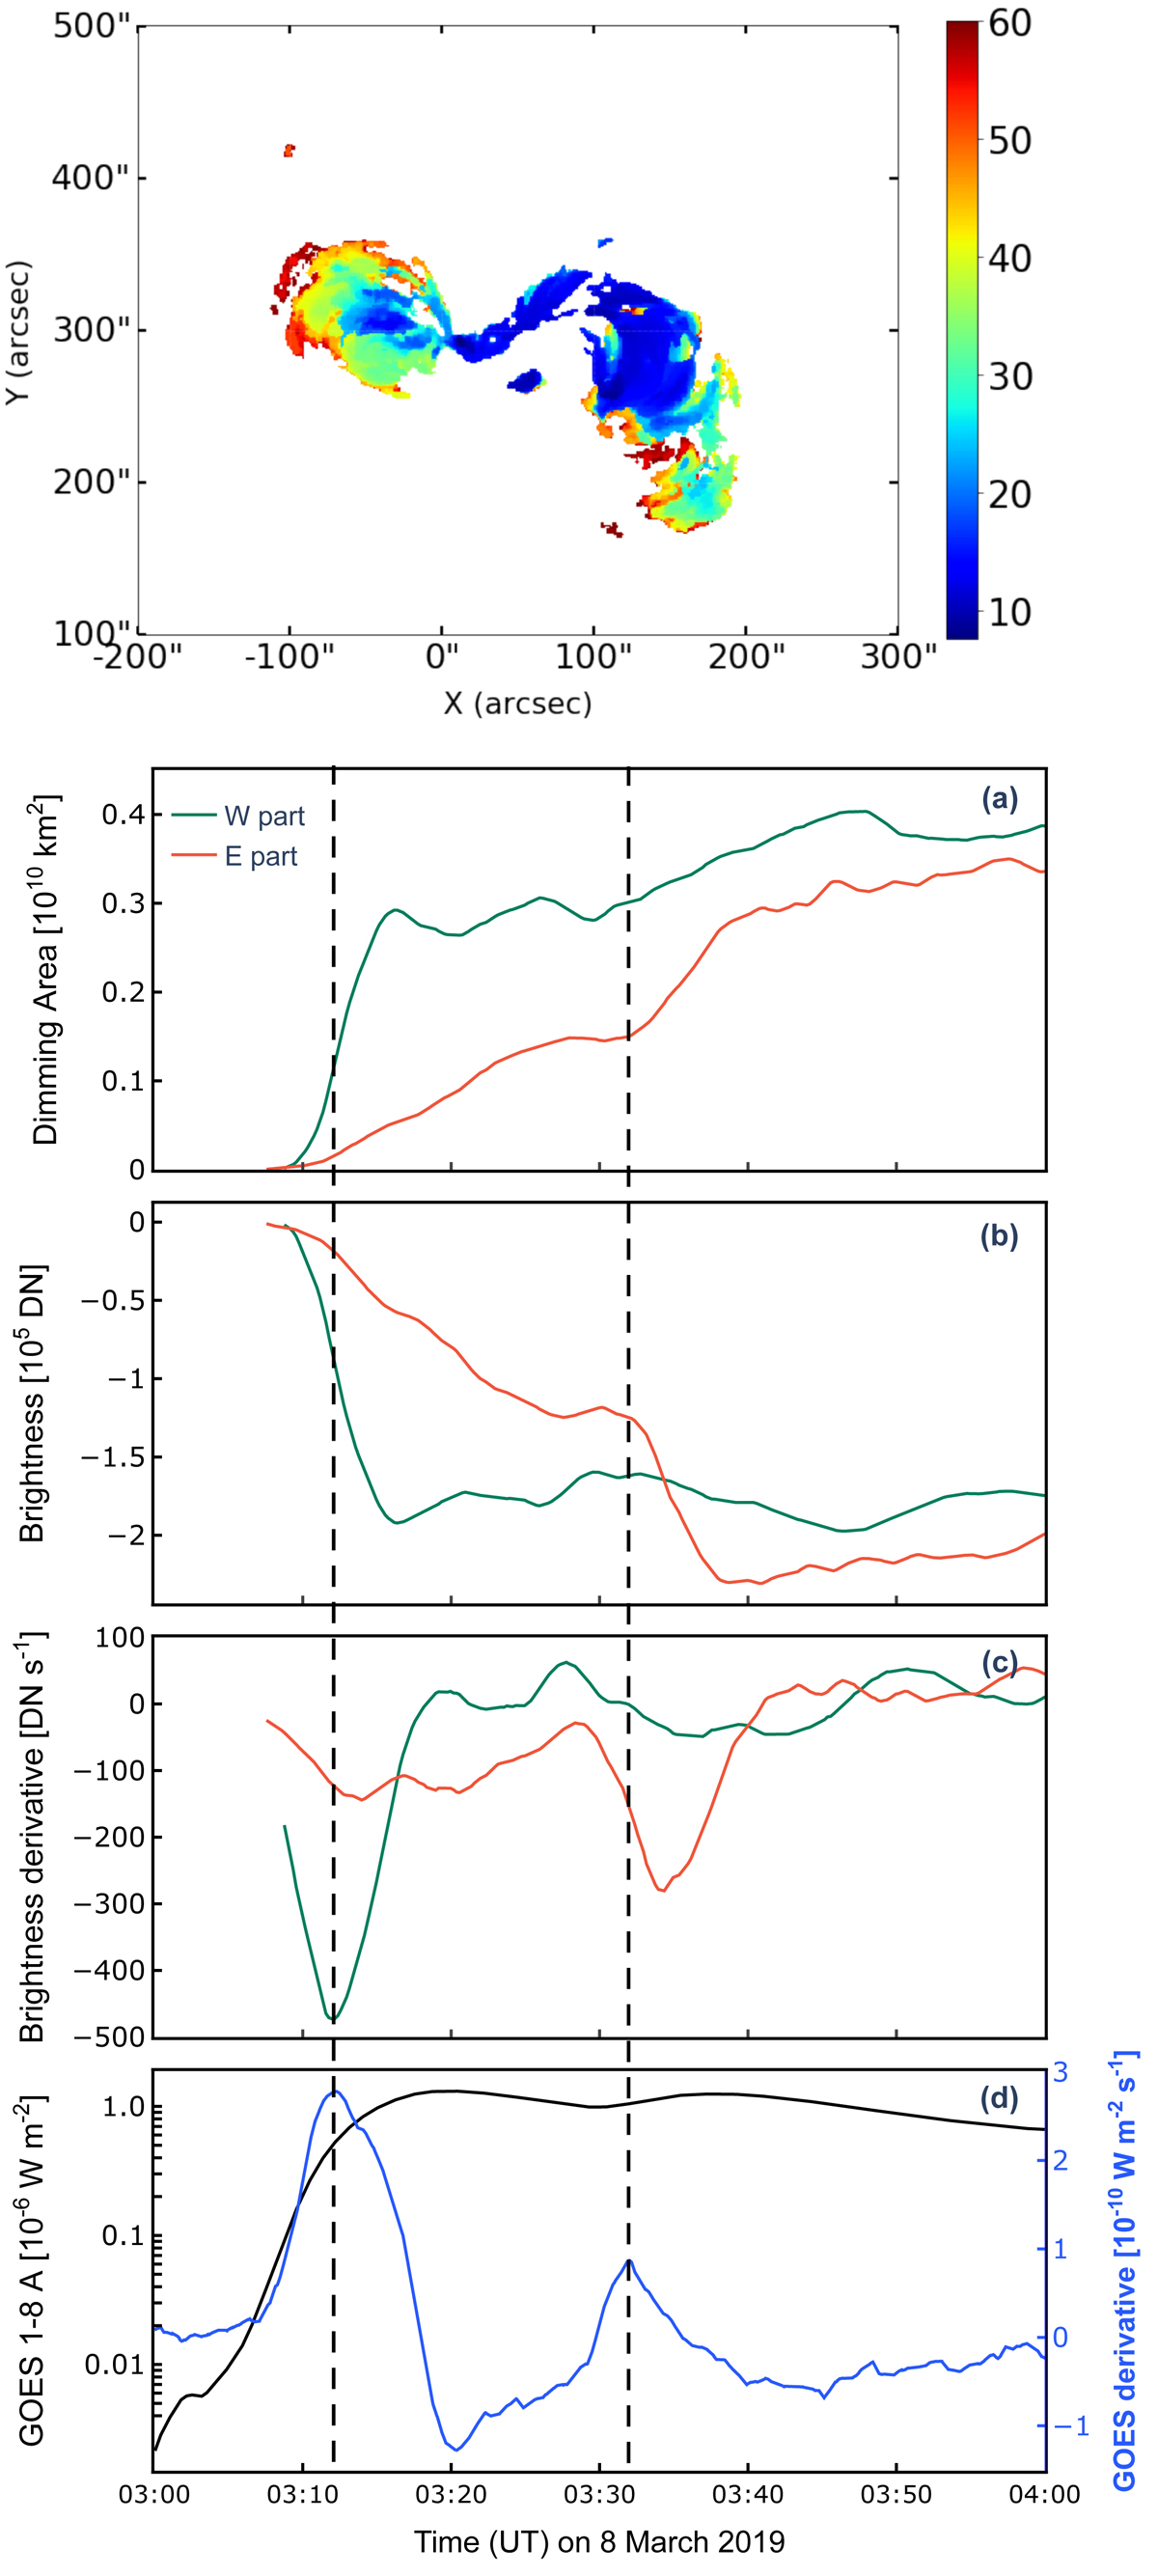
Download original image
Time evolution of the coronal dimming. Top panel: timing map of the coronal dimming region indicating when each dimming pixel was detected for the first time. The color bar in the timing map gives the time (in minutes) after 03:00 UT. Bottom panels a–d: time evolution of the derived coronal dimming parameters: (a) instantaneous dimming area and (b) brightness, calculated separately for the eastern (orange) and western (green) components of the dimming region. (c) Time derivative of the dimming brightness plotted in panel b. (d) GOES 1–8 Å soft X-ray light curve and 0.5–4 Å time derivative of the flare emission. Two vertical dashed lines mark the peaks in GOES derivative. The curves are smoothed with a forward-backward exponential smoothing method (Brown 1963).
Current usage metrics show cumulative count of Article Views (full-text article views including HTML views, PDF and ePub downloads, according to the available data) and Abstracts Views on Vision4Press platform.
Data correspond to usage on the plateform after 2015. The current usage metrics is available 48-96 hours after online publication and is updated daily on week days.
Initial download of the metrics may take a while.