Fig. 4.
Download original image
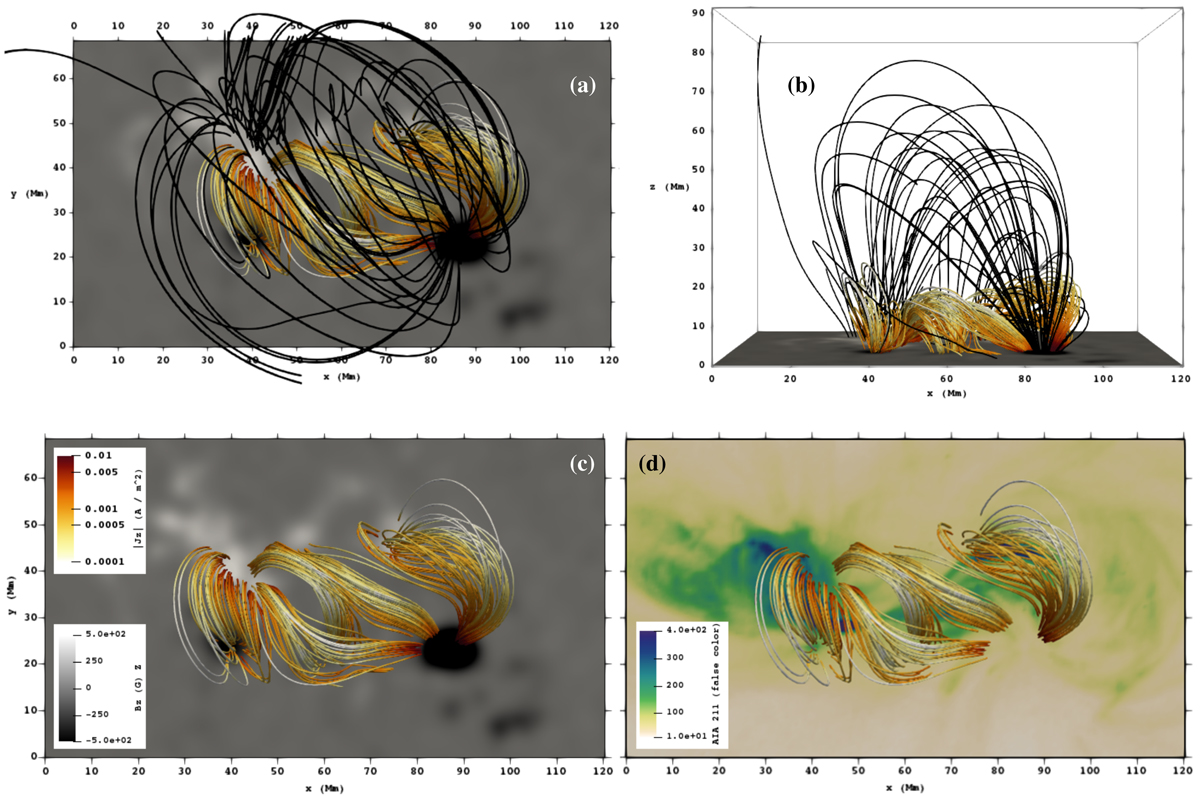
NLFF coronal magnetic field of AR 12734 on 2019 March 8 at 02:59 UT (prior to the flare). (a) In addition to the field line connectivity in the AR core (colored), model field lines outlining the overlying field are shown in black. (b) Same as in (a) but when viewed along the positive y-direction. In the bottom panels NLFF coronal magnetic field is displayed on top of (c) the NLFF lower boundary B_z, and (d) a false-color AIA 211 Å image. Model field lines are drawn from randomly selected footpoints and color-coded according to the mean absolute vertical current density at both footpoints.
Current usage metrics show cumulative count of Article Views (full-text article views including HTML views, PDF and ePub downloads, according to the available data) and Abstracts Views on Vision4Press platform.
Data correspond to usage on the plateform after 2015. The current usage metrics is available 48-96 hours after online publication and is updated daily on week days.
Initial download of the metrics may take a while.