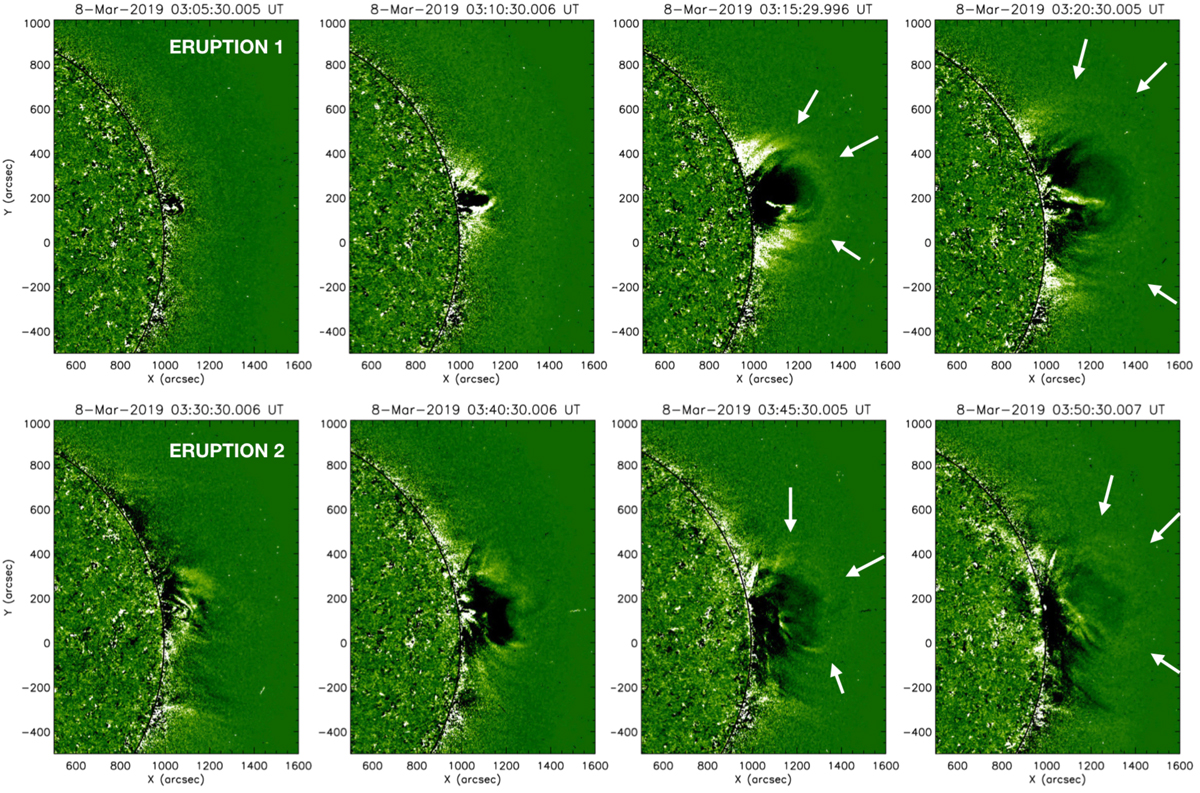
Fig. 3.
Download original image
STEREO-A/EUVI 195 Å running difference images showing the early evolution of the two eruptions on the Western limb. Top row: first ejection which is initiated low in the corona and associated with the first peak in the GOES/SXR flux at around 03:18 UT. Bottom row: second ejection, starting higher up in the corona corresponding to the second peak in GOES/SXR at around 03:37 UT. The white arrows indicate the leading edge of the eruptions. A movie accompanying the figure is available online (movie2).
Current usage metrics show cumulative count of Article Views (full-text article views including HTML views, PDF and ePub downloads, according to the available data) and Abstracts Views on Vision4Press platform.
Data correspond to usage on the plateform after 2015. The current usage metrics is available 48-96 hours after online publication and is updated daily on week days.
Initial download of the metrics may take a while.