Fig. 2.
Download original image
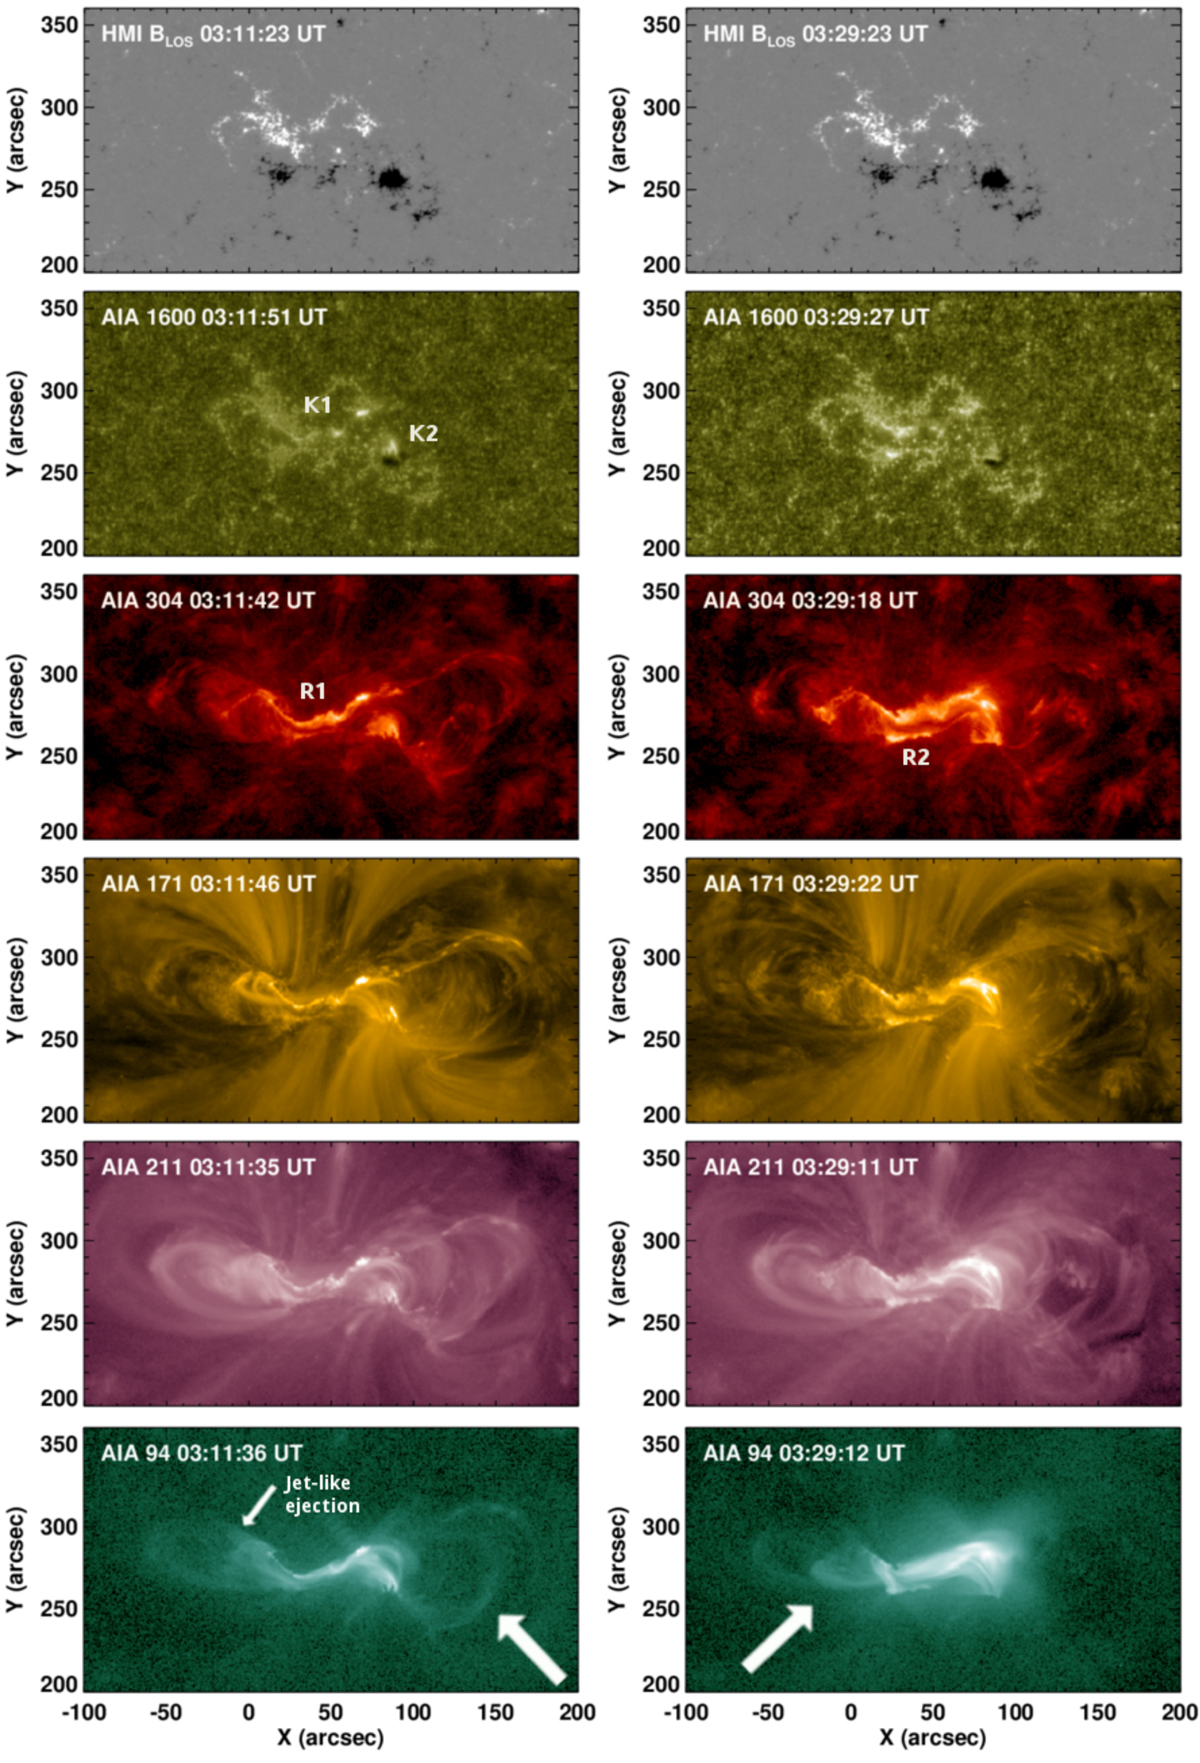
Magnetic field and (E)UV emission during the extended impulsive phase of the C1.3 flare on 2019 March 8 (SOL-2019-03-08T03:07C1.3). The panels in the two columns correspond to the two phases of the double peaked flare and two eruptions from the same NOAA AR 12734. Namely, snapshots are shown at two time steps corresponding to the first (around 03:12 UT; left column) and second (around 03:30 UT; right column) flare-related eruption. Top to bottom rows: HMI line-of-sight magnetic field maps, AIA 1600, 304, 171, 211, and 94 Å filtergrams. Labels “K1” and “K2” in AIA 1600 Å filtergrams refer to locations of flare kernels; labels “R1” and ‘R2” in AIA 304 Å filtergrams to corresponding flare ribbons. The large white arrows in the AIA 94 Å filtergrams point to the location of erupting loops during stage one and two of the flare process, respectively. The small arrow in the bottom left AIA 94 Å filtergram points to the location of a narrow ejection to the north-east direction during the first stage. A movie accompanying the figure is available online (movie1).
Current usage metrics show cumulative count of Article Views (full-text article views including HTML views, PDF and ePub downloads, according to the available data) and Abstracts Views on Vision4Press platform.
Data correspond to usage on the plateform after 2015. The current usage metrics is available 48-96 hours after online publication and is updated daily on week days.
Initial download of the metrics may take a while.