Fig. 13.
Download original image
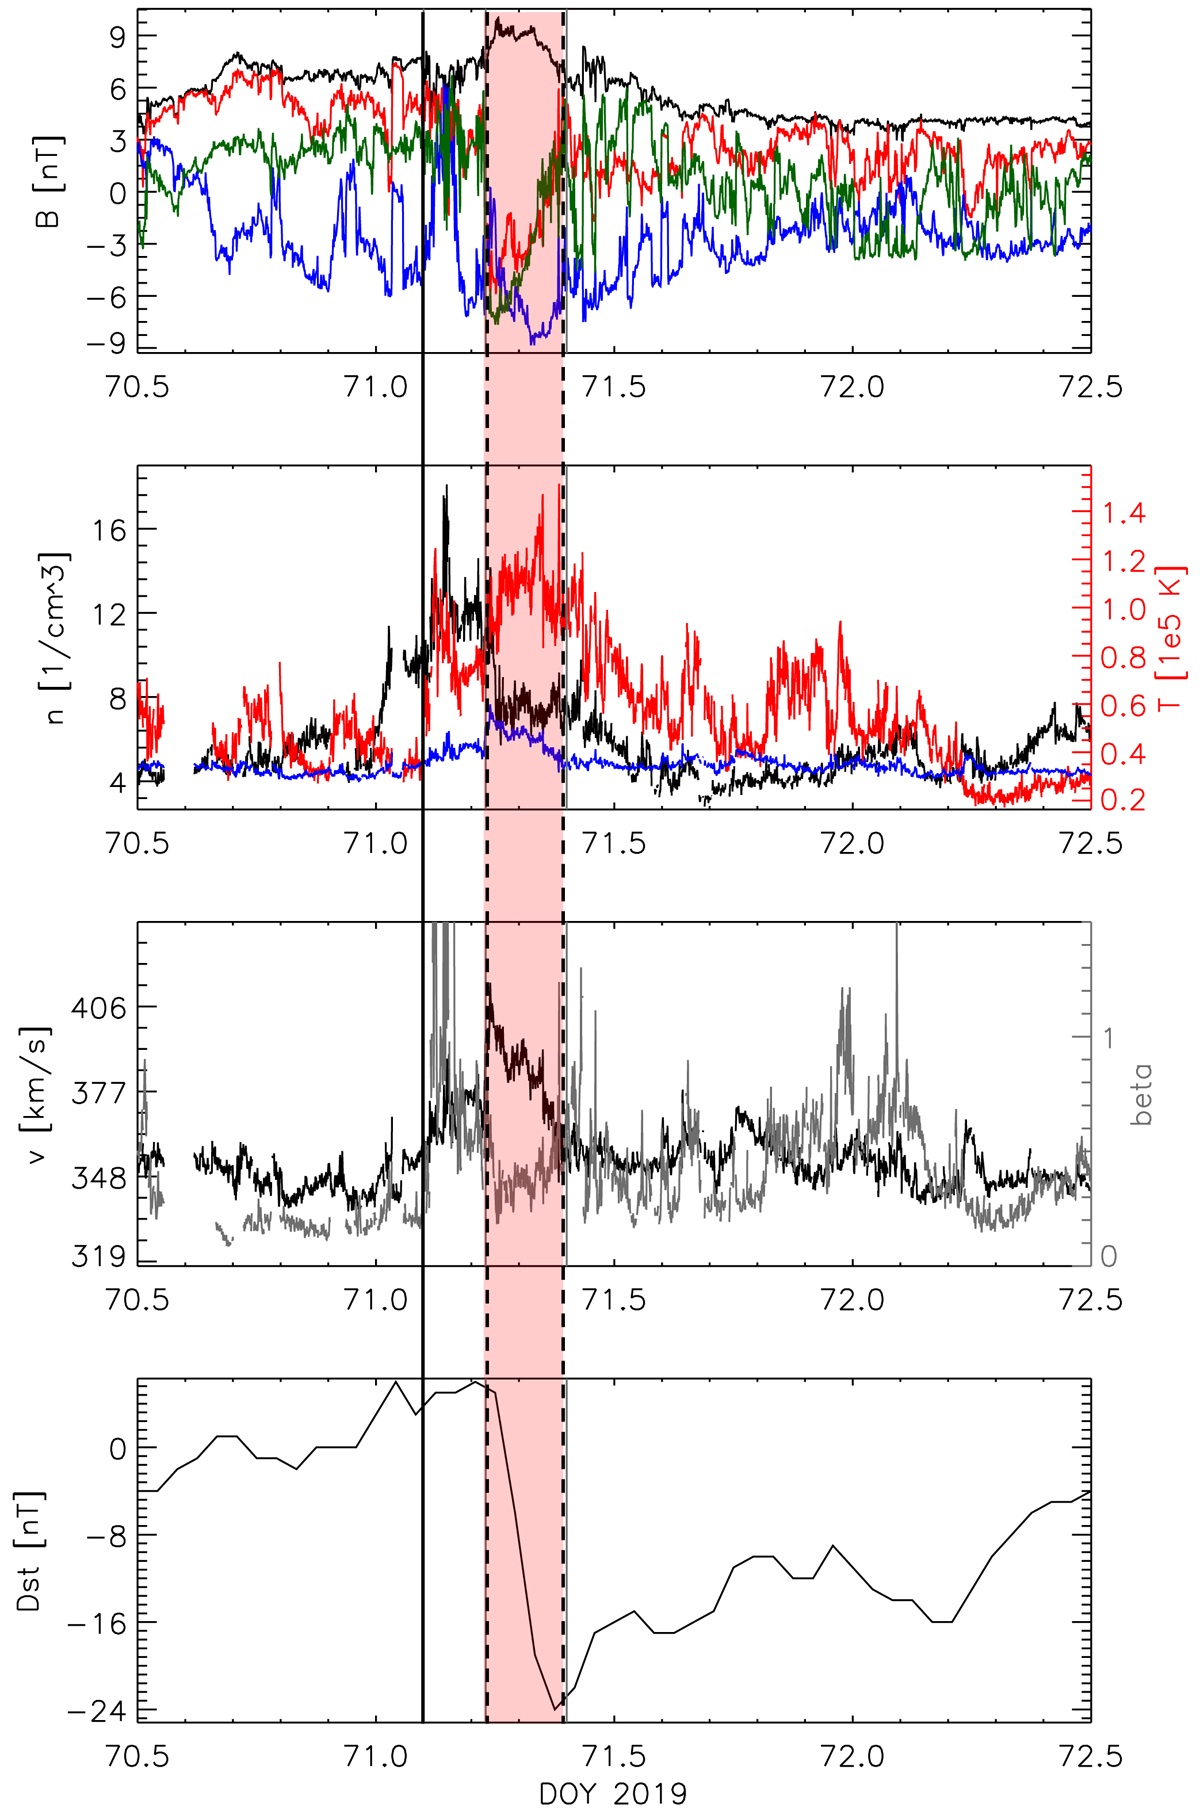
In situ measurements given in day-of-year (doy) time series around 2019 March 12 (doy 71). Top-to-bottom panels: (1) magnetic field strength (black) and its components x, y, z in Geocentric solar ecliptic (GSE) colored red, blue, and green, respectively; (2) plasma density (black), temperature (red) and expected temperature (blue); (3) plasma flow speed (black) and beta (gray); (4) Dst index. The expected temperature was calculated according to Lopez (1987) and Richardson & Cane (1995). The SFR is highlighted red, with dashed lines outlining its borders. The solid line marks the start of what appears to be a pile-up region ahead of the SFR (for details see main text).
Current usage metrics show cumulative count of Article Views (full-text article views including HTML views, PDF and ePub downloads, according to the available data) and Abstracts Views on Vision4Press platform.
Data correspond to usage on the plateform after 2015. The current usage metrics is available 48-96 hours after online publication and is updated daily on week days.
Initial download of the metrics may take a while.