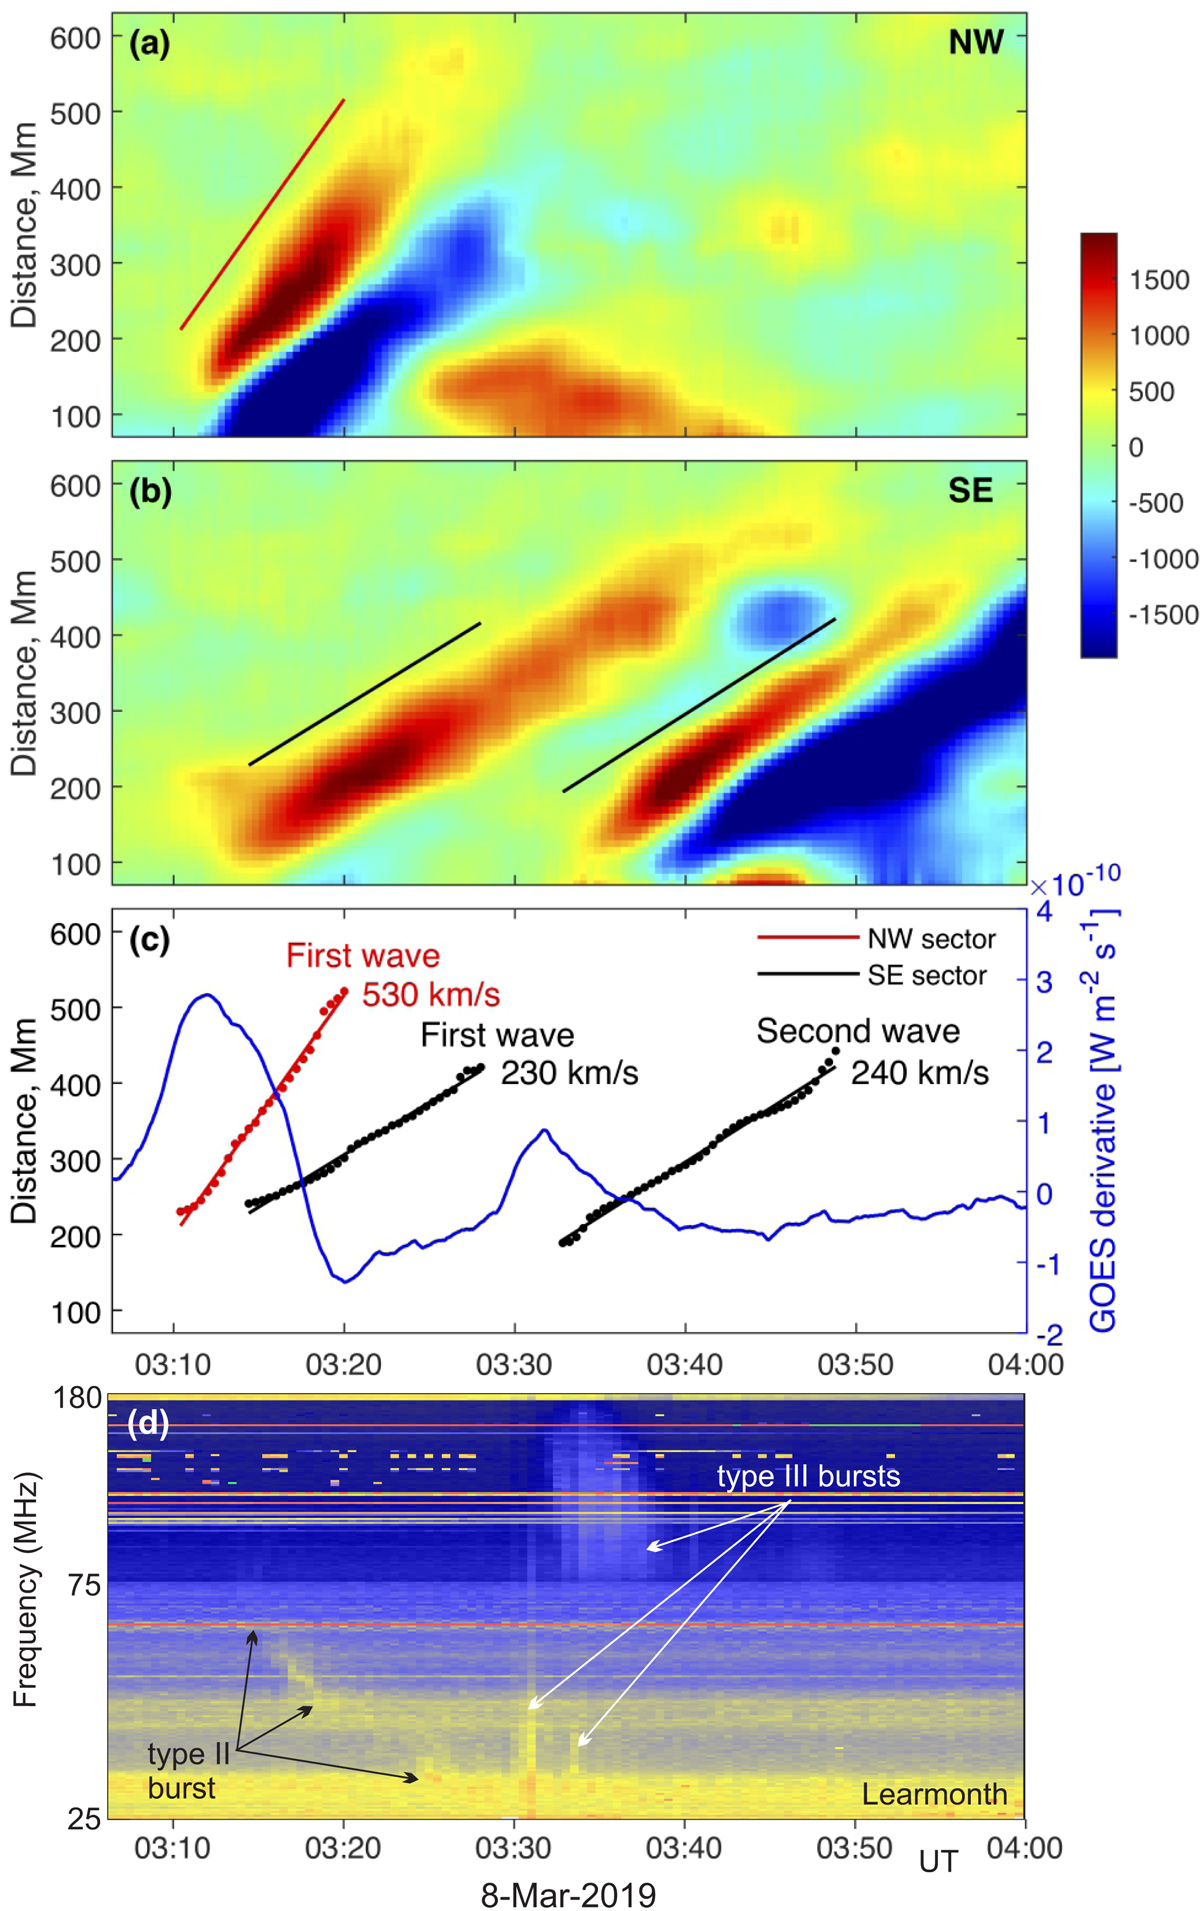
Fig. 10.
Download original image
EUV wave kinematics. (a, b) Stack plots derived from the ring analysis applied to SDO/AIA 193 Å running difference images for the wave segments in the propagation of the NW and SE sector, respectively (indicated in Fig. 8). (c) Distance-time profiles of the leading fronts of the first EUV wave in the NW (red) and two consecutive EUV waves in the SE sector (black). Dots denote data points, the dashed lines the linear fit. The blue line shows the time derivative of the GOES 0.5–4 Å soft X-ray flux of the associated flare. (d) The dynamic radio spectrum recorded by the Learmonth Radio Spectrograph shows the radio emission associated with the EUV waves. The type II radio burst seems to be temporally associated with the first peak and the type III bursts are associated with the second peak of the derivative of GOES soft X-ray flux.
Current usage metrics show cumulative count of Article Views (full-text article views including HTML views, PDF and ePub downloads, according to the available data) and Abstracts Views on Vision4Press platform.
Data correspond to usage on the plateform after 2015. The current usage metrics is available 48-96 hours after online publication and is updated daily on week days.
Initial download of the metrics may take a while.