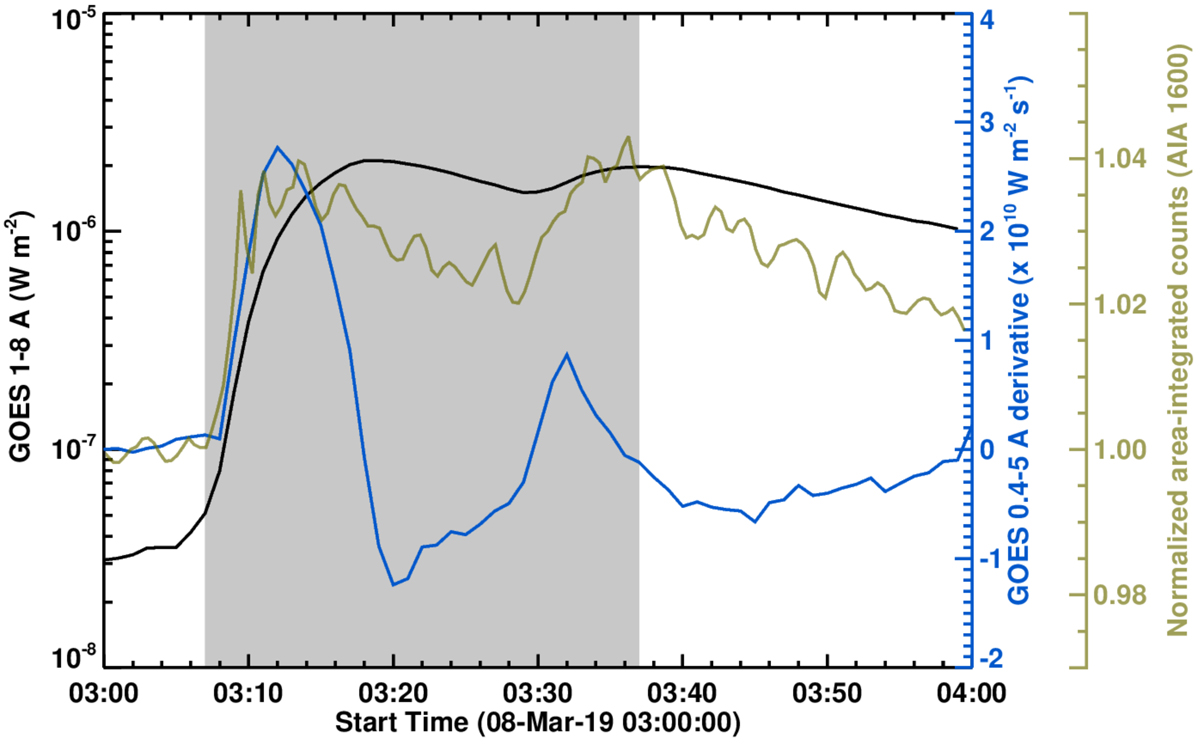
Fig. 1.
Download original image
Soft X-ray and ultraviolet emission during the C1.3 flare (SOL-2019-03-08T03:07) on 2019 March 8. We show the full-disk integrated GOES 1–8 Å SXR emission (black curve), the time derivative of the GOES 0.5–4 Å emission (blue curve), and the NOAA AR 12734 area-integrated AIA 1600 Å emission (green) normalized to the pre-flare state at 03:00:23 UT. The gray-shaded vertical band marks the extended impulsive phase of the C1.3 flare, covering the time span between the nominal GOES start time and the time of the second peak in the GOES 1–8 Å SXR emission.
Current usage metrics show cumulative count of Article Views (full-text article views including HTML views, PDF and ePub downloads, according to the available data) and Abstracts Views on Vision4Press platform.
Data correspond to usage on the plateform after 2015. The current usage metrics is available 48-96 hours after online publication and is updated daily on week days.
Initial download of the metrics may take a while.