Fig. 2.
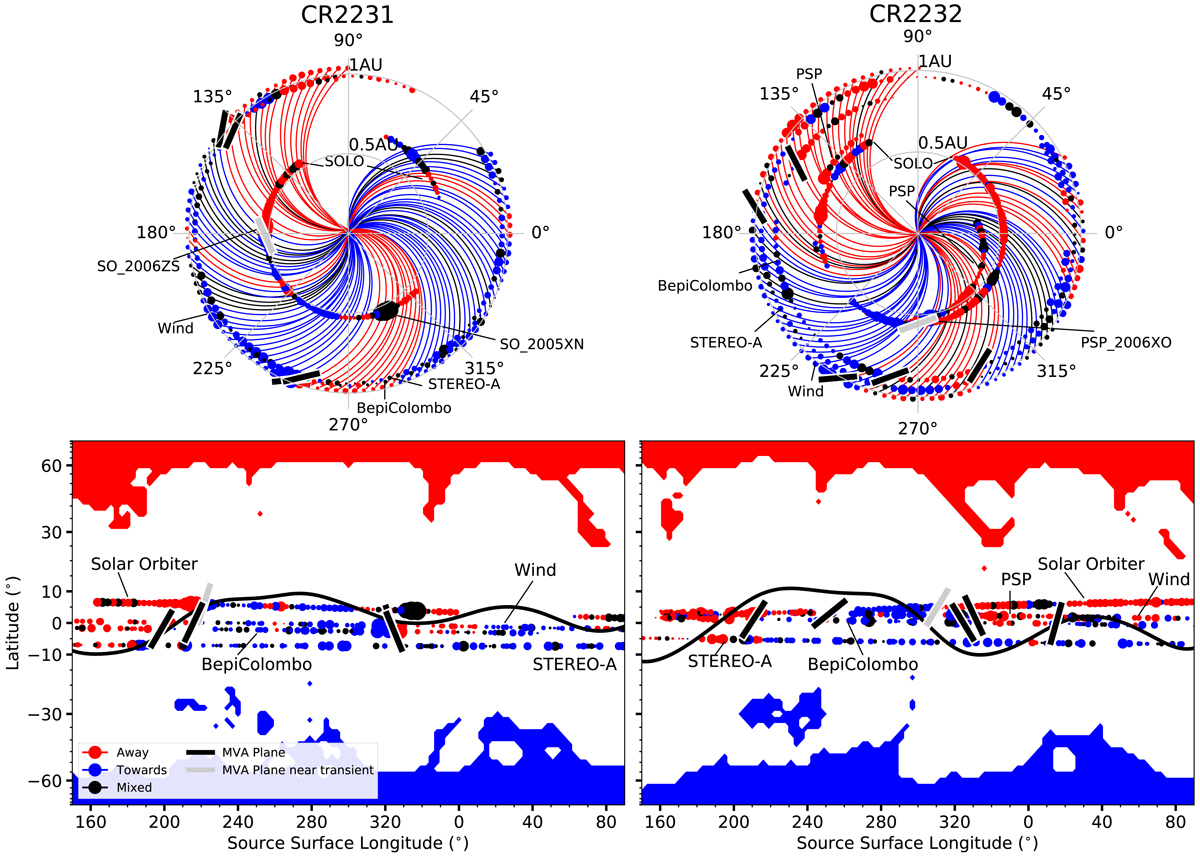
Sector boundary orientations with respect to the polarity structure measured by the in situ spacecraft. Top panels: in situ measurements in the IAU_SUN frame, where the angle of the HCS found from MVA is compared to the Parker spiral. The surrounding angles are of Carrington longitude, which is not the source surface longitude, as plotted in the bottom panels. The source surface longitude can be estimated by following a Parker spiral line that is plotted based on measurements from Wind. These angles are generally parallel to the local Parker spiral direction, with the boundaries associated with transients shown in grey. These plots also give context to where the different spacecraft were during these two rotations, with BepiColombo progressing from 0.99 AU to 0.85 AU. Bottom panels: source surface as seen in Fig. 1, with the in situ orientation from different spacecraft overlaid, with the values in Table A.1. Although the orientations generally match the direction expected from the HCS, they are much steeper.
Current usage metrics show cumulative count of Article Views (full-text article views including HTML views, PDF and ePub downloads, according to the available data) and Abstracts Views on Vision4Press platform.
Data correspond to usage on the plateform after 2015. The current usage metrics is available 48-96 hours after online publication and is updated daily on week days.
Initial download of the metrics may take a while.