Fig. 1.
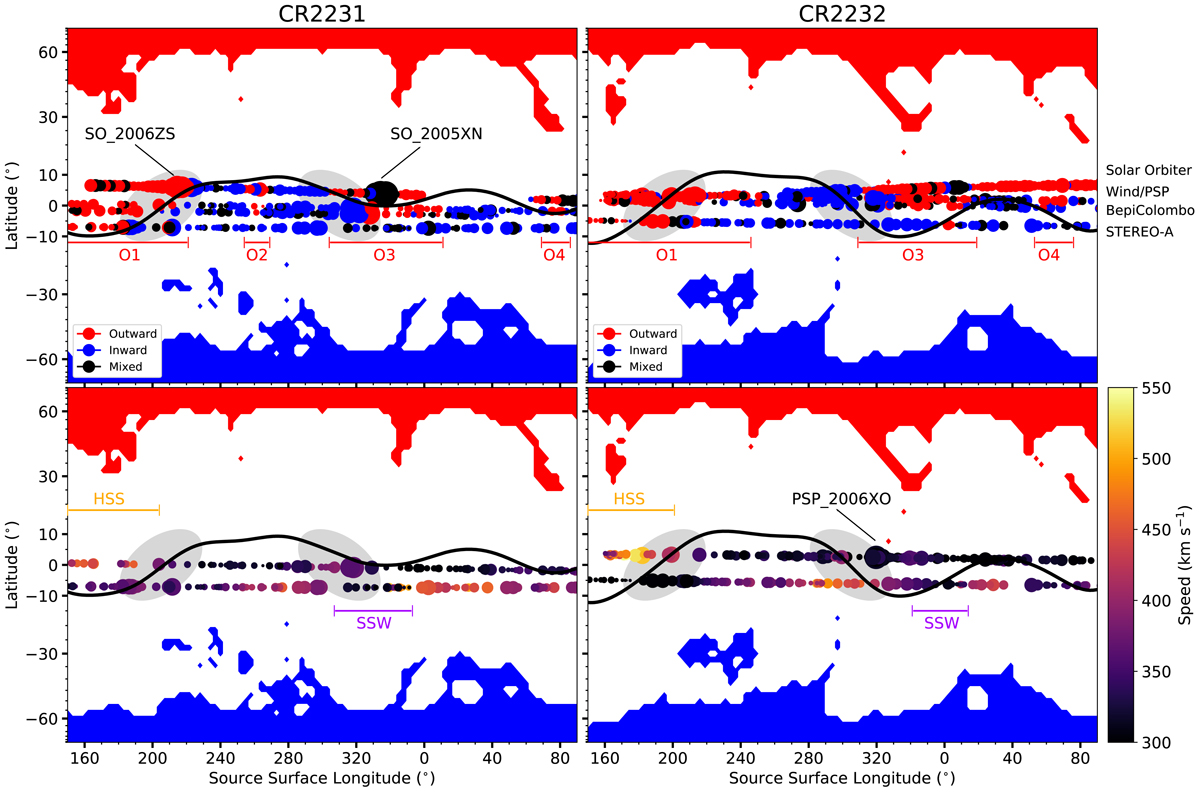
Scatter points representing a 6-h average of the in situ parameters from each spacecraft, where the size of the scatter point is proportional to (|B|×RSC)2 to accentuate changes in |B|. Top panels: polarity measured by the different spacecraft for the two solar rotations, as outlined in Sect. 2, with the order of the spacecraft trails next to the top right panel. In these plots, each spacecraft travelled from right to left, where measurements of the same longitude were made by all the spacecraft within a few days, therefore minimising temporal effects. Open field lines are shown as the colour map, as calculated from a PFSS model using an ADAPT magnetogram from 1 June and from 1 July for rotation CR2231 and CR2232, respectively. We ensured that the output of the PFSS model was stable by considering the predicted HCS shape at daily intervals throughout the periods of interest, with the estimated HCS position shown as the solid black line, which broadly matches the shape of the in situ observations. Bottom left panel: solar wind speed from Wind (above) and STEREO-A (below), with the bottom right panel also displaying the data from PSP at the same latitude as Wind. These maps, along with the open field lines from PFSS, show that the CH structure was stable over the two rotations with CIRs shown as highlighted grey regions at ∼200° and ∼320° longitude. This stable structure is also reflected in the polarity measurements, with outward polarity dips in the HCS outlined with the horizontal red lines. Transient structures are labelled with the according identification.
Current usage metrics show cumulative count of Article Views (full-text article views including HTML views, PDF and ePub downloads, according to the available data) and Abstracts Views on Vision4Press platform.
Data correspond to usage on the plateform after 2015. The current usage metrics is available 48-96 hours after online publication and is updated daily on week days.
Initial download of the metrics may take a while.