Fig. 6.
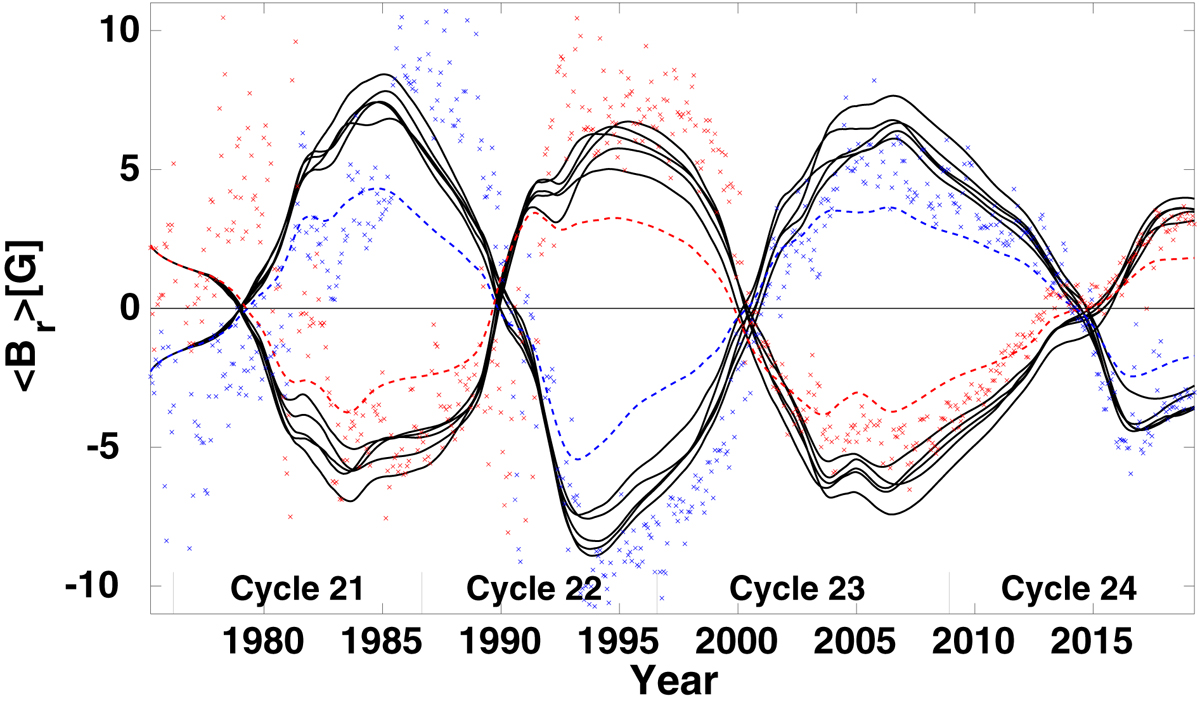
Average strength of polar fields above 60° and below −60° latitude from six SFT simulations. The dashed lines depict a simulation that included only observed active regions. The solid black lines show five simulations that included additional far-side active regions with a lifetime limit of seven days. The red and blue crosses are observed values of the northern and southern polar fields determined from synoptic maps.
Current usage metrics show cumulative count of Article Views (full-text article views including HTML views, PDF and ePub downloads, according to the available data) and Abstracts Views on Vision4Press platform.
Data correspond to usage on the plateform after 2015. The current usage metrics is available 48-96 hours after online publication and is updated daily on week days.
Initial download of the metrics may take a while.