Fig. 3.
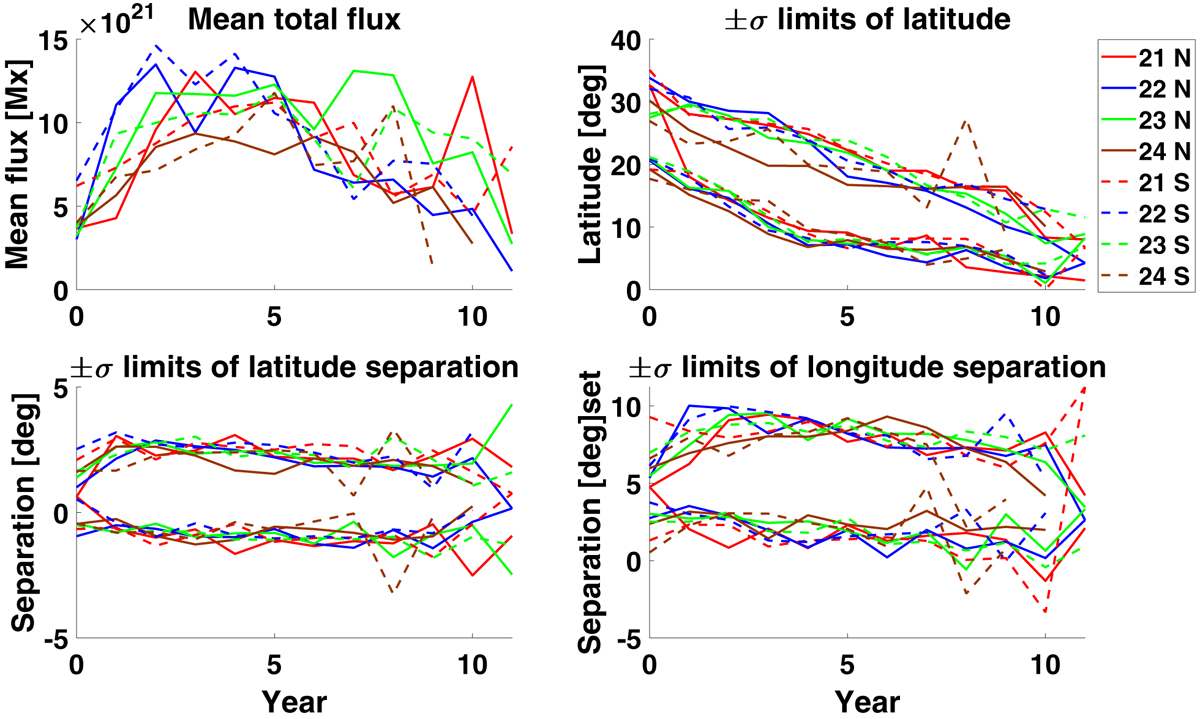
Properties of observed active regions with a lifetime of less than seven days calculated for northern and southern wings of cycles 21–24. Values are yearly means and the first year of each wing starts from the emergence of the first active region of that wing. Top left panel: mean total unsigned flux. Top right panel: limits of plus and minus one standard deviation around mean latitude. Bottom left panel: limits of plus and minus one standard deviation around mean latitude separation of polarities. Bottom right panel: limits of plus and minus one standard deviation around mean longitude separation of polarities. Different colors mark different cycles. Solid lines are for northern wings; dashed lines for southern wings.
Current usage metrics show cumulative count of Article Views (full-text article views including HTML views, PDF and ePub downloads, according to the available data) and Abstracts Views on Vision4Press platform.
Data correspond to usage on the plateform after 2015. The current usage metrics is available 48-96 hours after online publication and is updated daily on week days.
Initial download of the metrics may take a while.