Free Access
Fig. 6.
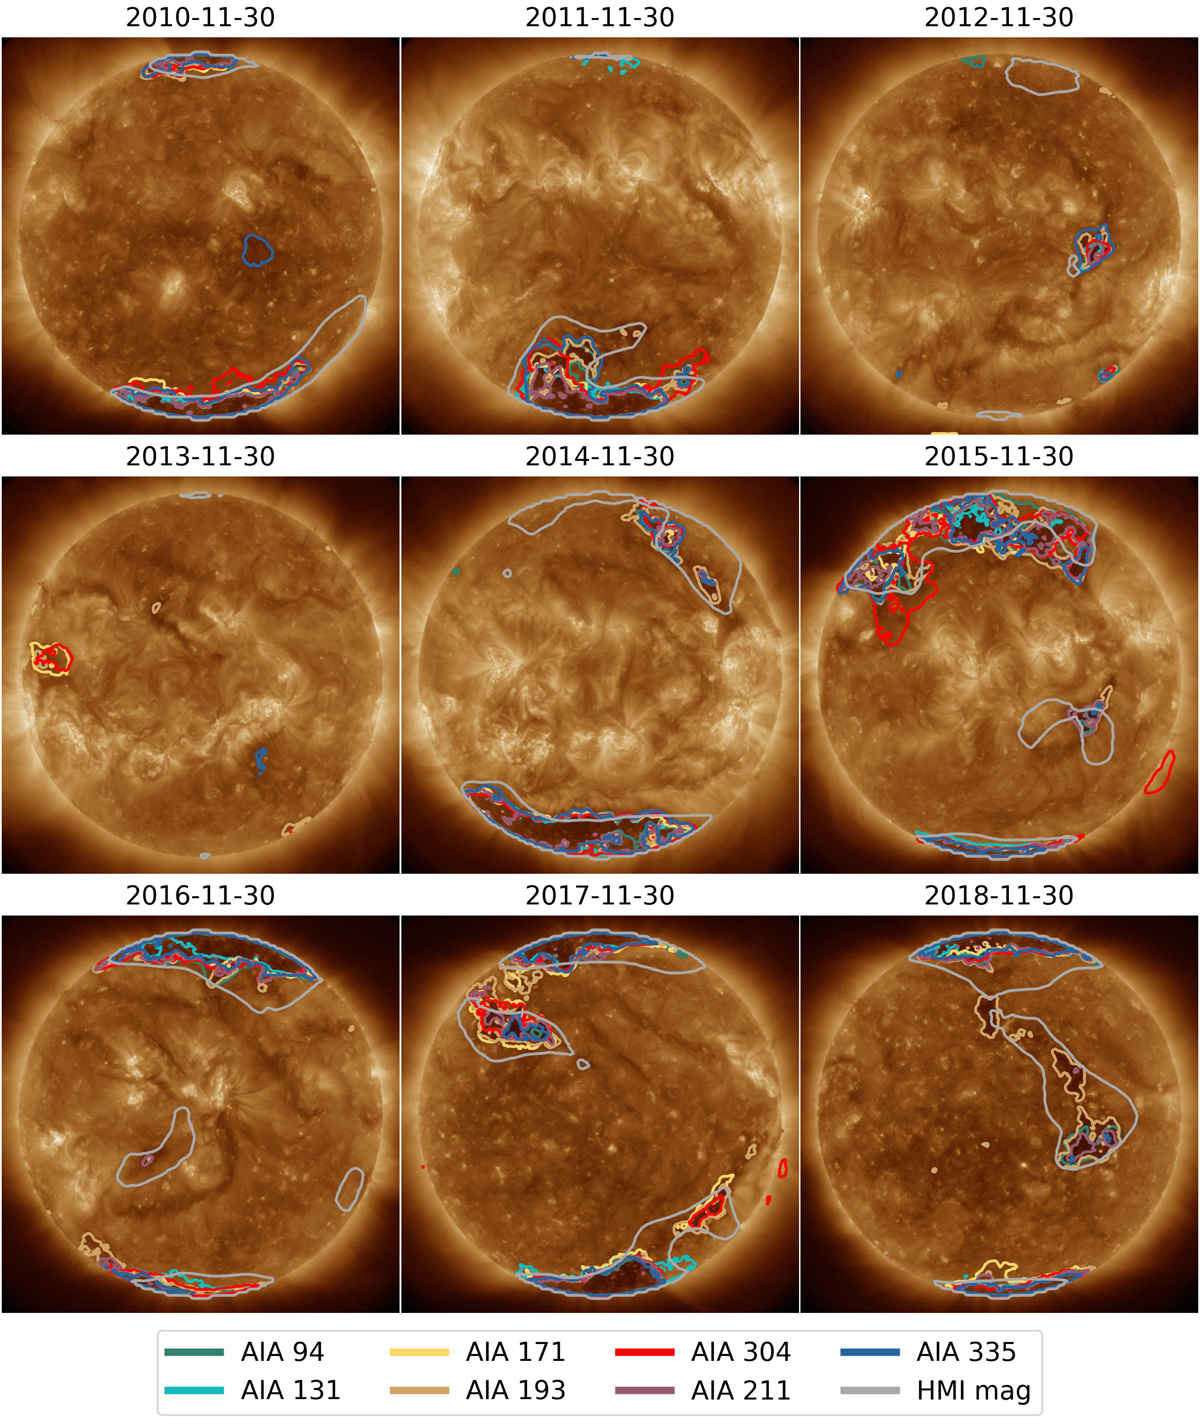
Comparison of the coronal hole boundary for each channel as detected by the SCAN models during 2010–2018. We show one example per year, each for the day November 30 (part of the test set).
Current usage metrics show cumulative count of Article Views (full-text article views including HTML views, PDF and ePub downloads, according to the available data) and Abstracts Views on Vision4Press platform.
Data correspond to usage on the plateform after 2015. The current usage metrics is available 48-96 hours after online publication and is updated daily on week days.
Initial download of the metrics may take a while.