Fig. 15.
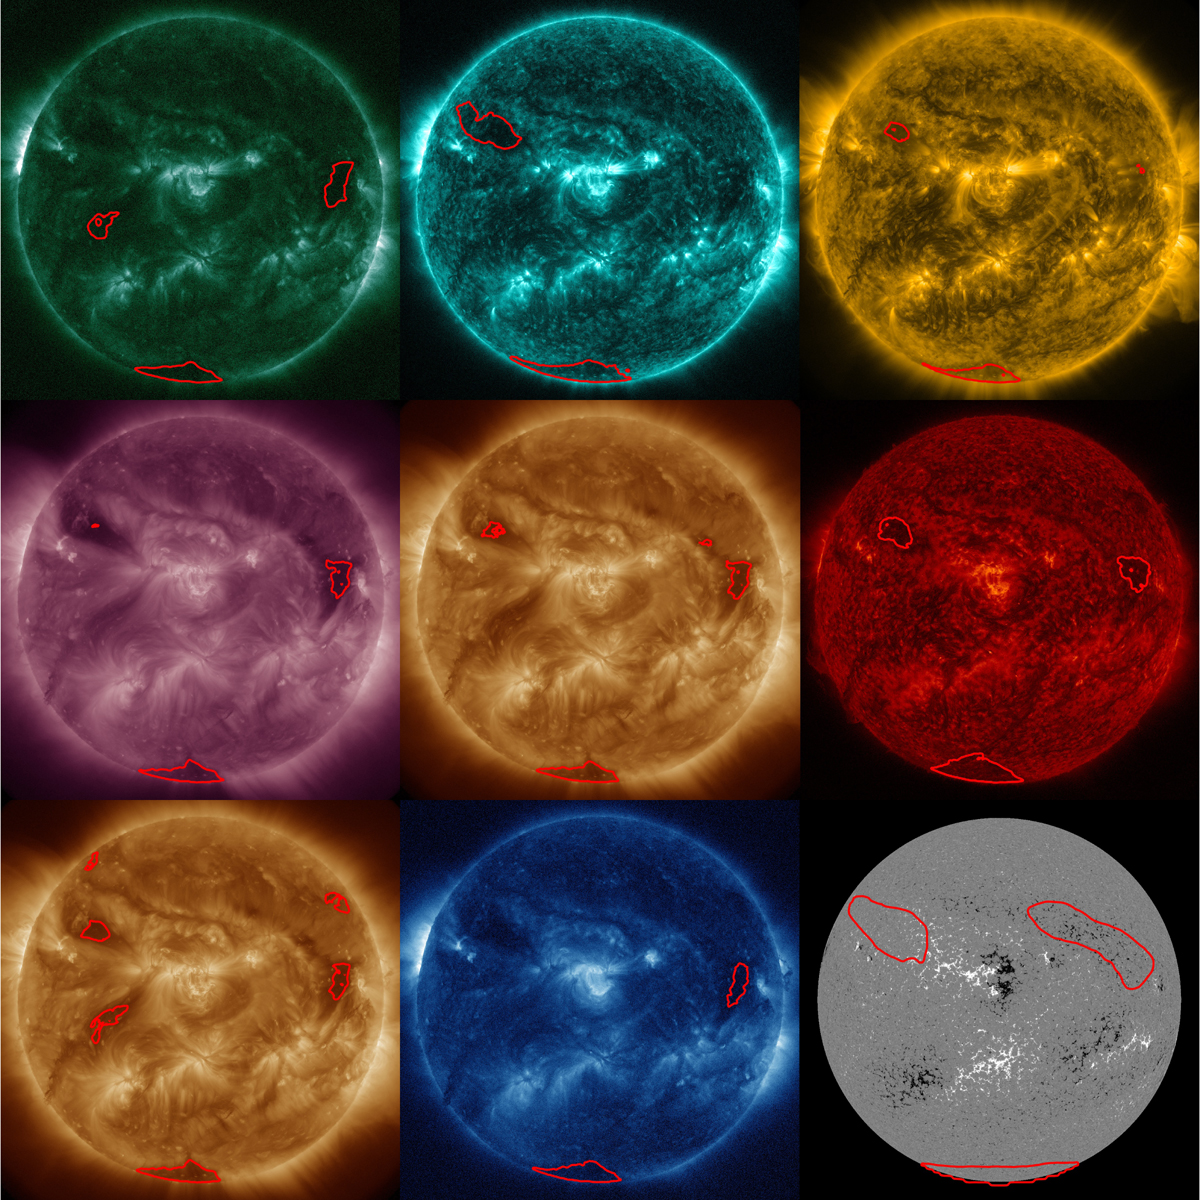
Sample of the SCAN models and CHRONNOS from 2015-11-19. The rows show images of (from left to right): (1) 94 Å, 131 Å, 171 Å; (2) 211 Å, CHRONNOS, 304 Å; (3) 193 Å, 335 Å, and the LOS magnetogram. The model detections are shown as red contour lines for the corresponding channels. The combined channel result of CHRONNOS (center) is plotted as an overlay onto 193 Å but is obtained from the combined set of channels. The animated version of this figure can be found online (Movie 2).
Current usage metrics show cumulative count of Article Views (full-text article views including HTML views, PDF and ePub downloads, according to the available data) and Abstracts Views on Vision4Press platform.
Data correspond to usage on the plateform after 2015. The current usage metrics is available 48-96 hours after online publication and is updated daily on week days.
Initial download of the metrics may take a while.