Fig. 12.
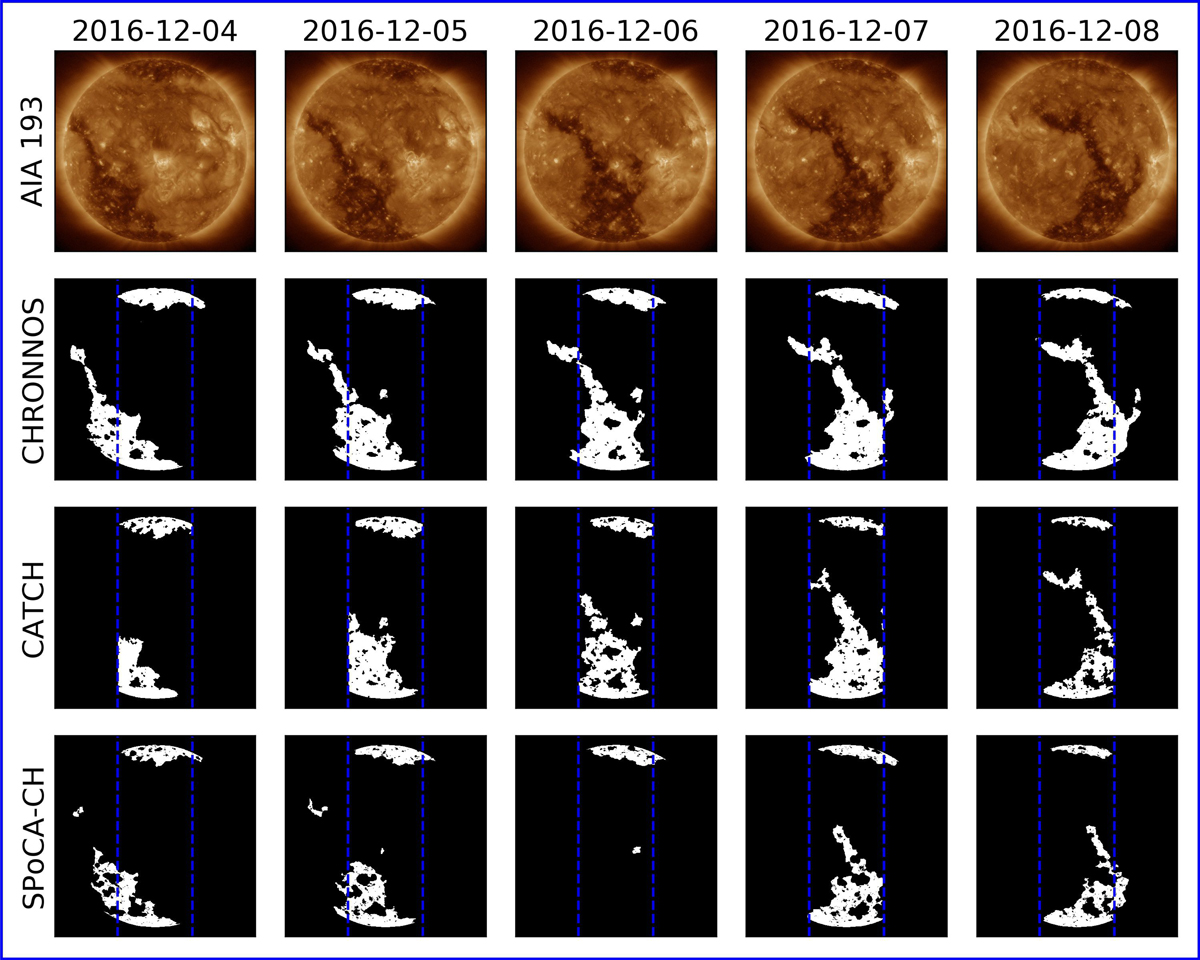
Comparison of the segmentation maps of the three different methods for five consecutive days. Top row: 193 Å filtergrams of the respective day and the rows below show the corresponding segmentation maps of our CHRONNOS model, the manual CATCH labels, and the semi-automatic SPoCA-CH labels. The blue dashed lines refer to ±400″ of the central slice. We note that the CATCH results shown are only for the region within the slice, whereas CHRONNOS and SPoCA-CH evaluated the full solar disk.
Current usage metrics show cumulative count of Article Views (full-text article views including HTML views, PDF and ePub downloads, according to the available data) and Abstracts Views on Vision4Press platform.
Data correspond to usage on the plateform after 2015. The current usage metrics is available 48-96 hours after online publication and is updated daily on week days.
Initial download of the metrics may take a while.