Fig. 11.
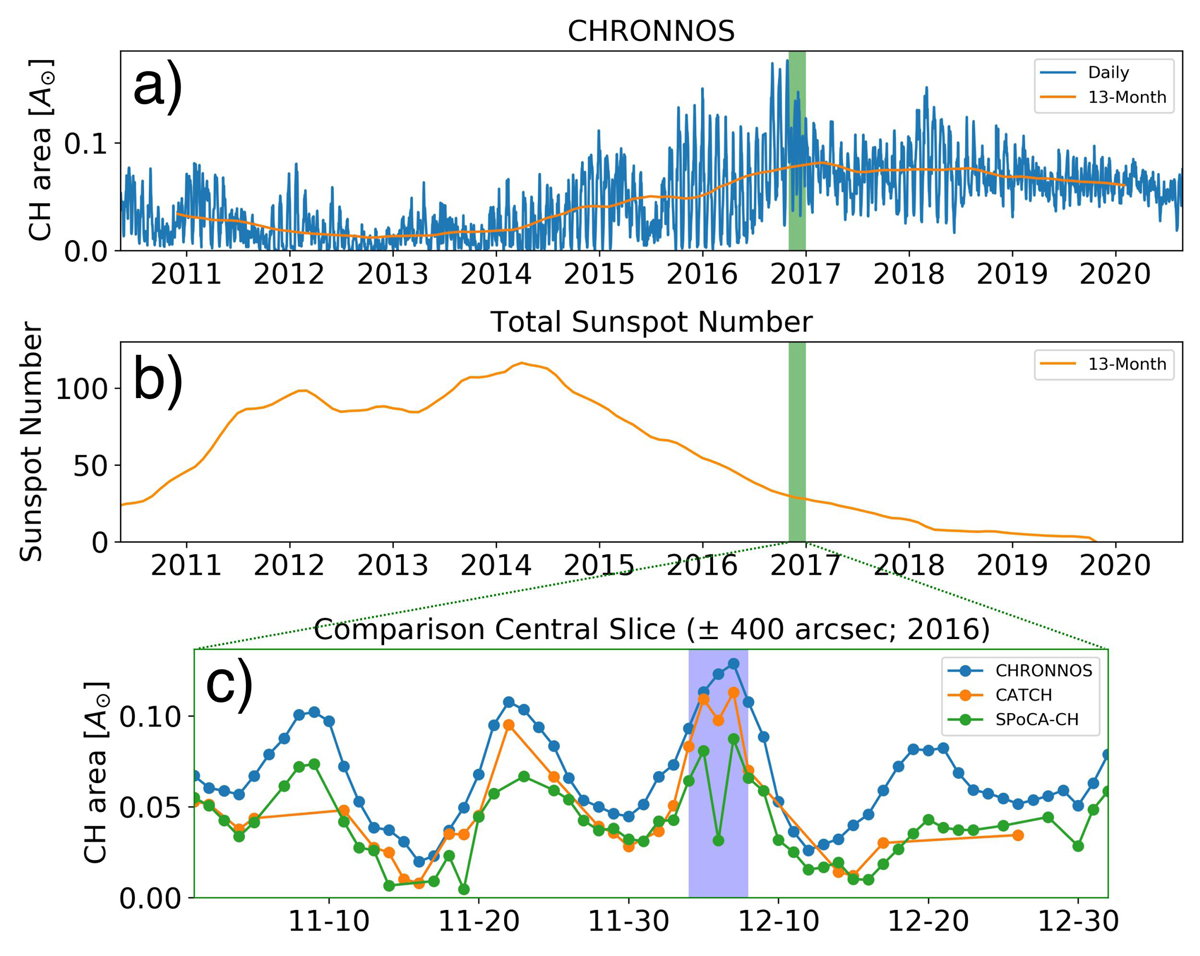
Analysis of the temporal consistency of the CHRONNOS model. (a) Daily variation in coronal hole area over the full disk, as given by our model, over the full data set from 2010-05-13 to 2020-08-25 (blue) and a 13 month smoothed total coronal hole area by a mean filter (orange). (b) 13 month smoothed series of the total sunspot number, for comparison to the coronal hole area (SILSO World Data Center 2010-2020, http://www.sidc.be/silso/). (c) Time line from 2016-11-01 to 2016-12-31 for the CHRONNOS model (blue), the manual CATCH labels (orange), and the SPoCA-CH labels (green). The areas in (panel c) are evaluated within the central slice (±400″). The last two months of each year and all observations from 2017 onward correspond to the test set and show a smooth transition with the samples of the training set. The blue shaded area corresponds to the samples shown in Fig. 12.
Current usage metrics show cumulative count of Article Views (full-text article views including HTML views, PDF and ePub downloads, according to the available data) and Abstracts Views on Vision4Press platform.
Data correspond to usage on the plateform after 2015. The current usage metrics is available 48-96 hours after online publication and is updated daily on week days.
Initial download of the metrics may take a while.