Fig. 10.
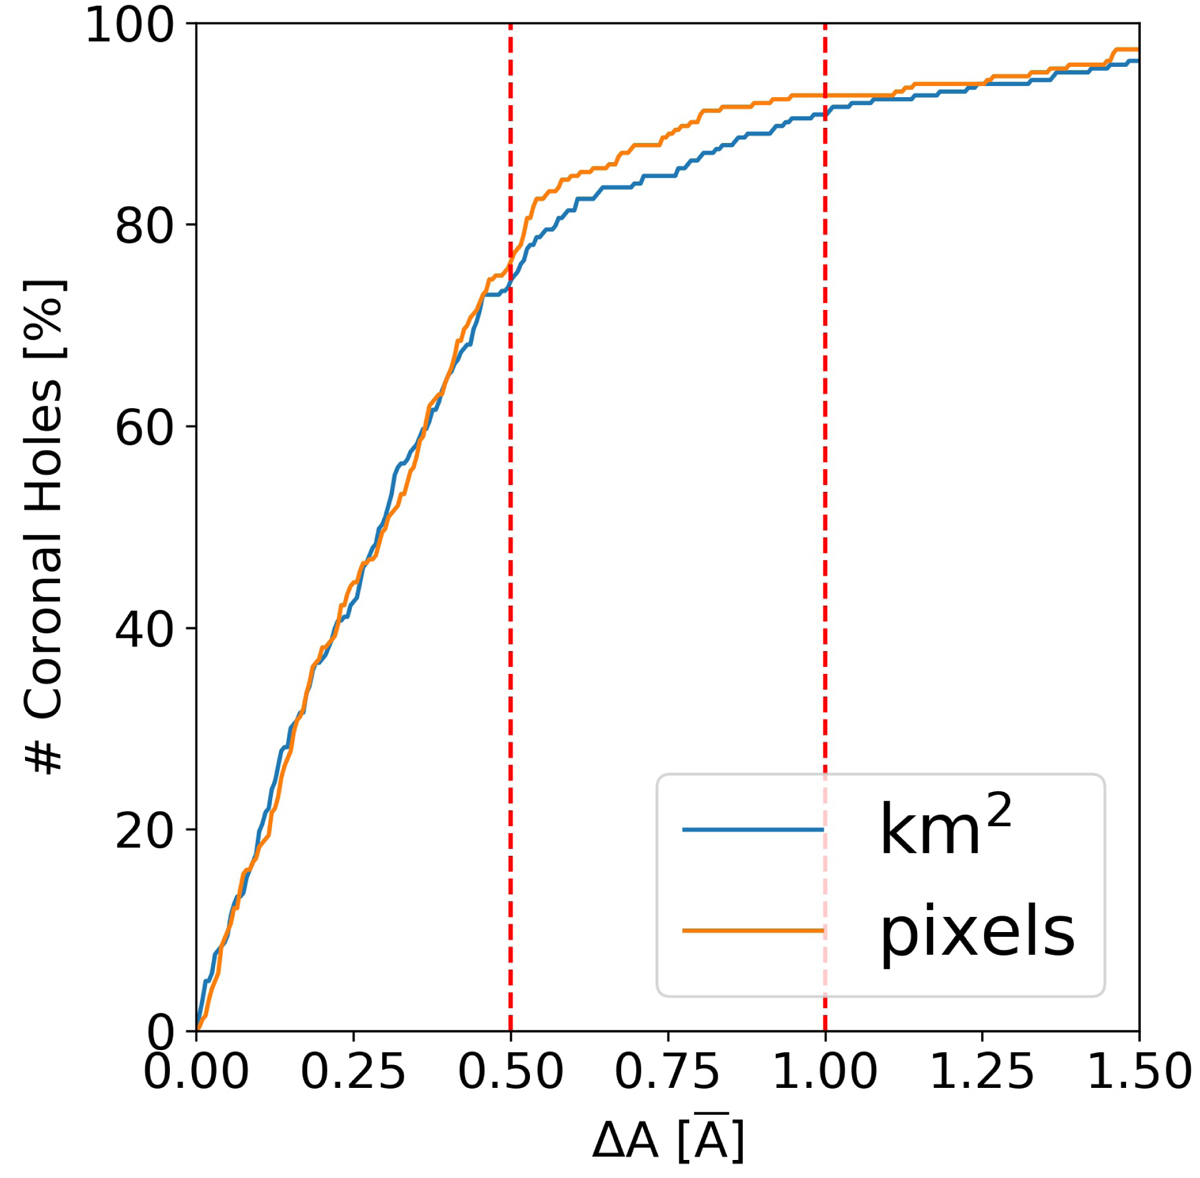
Evaluation of the agreement in coronal hole area. The plot shows the cumulative percentage of coronal holes as function of the difference in the derived areas ΔA, given in fractions of the mean coronal hole area of the CATCH and CHRONNOS detection. The comparison is performed in terms of the deprojected area (km2; blue) and pixel area (orange).
Current usage metrics show cumulative count of Article Views (full-text article views including HTML views, PDF and ePub downloads, according to the available data) and Abstracts Views on Vision4Press platform.
Data correspond to usage on the plateform after 2015. The current usage metrics is available 48-96 hours after online publication and is updated daily on week days.
Initial download of the metrics may take a while.