Fig. 5.
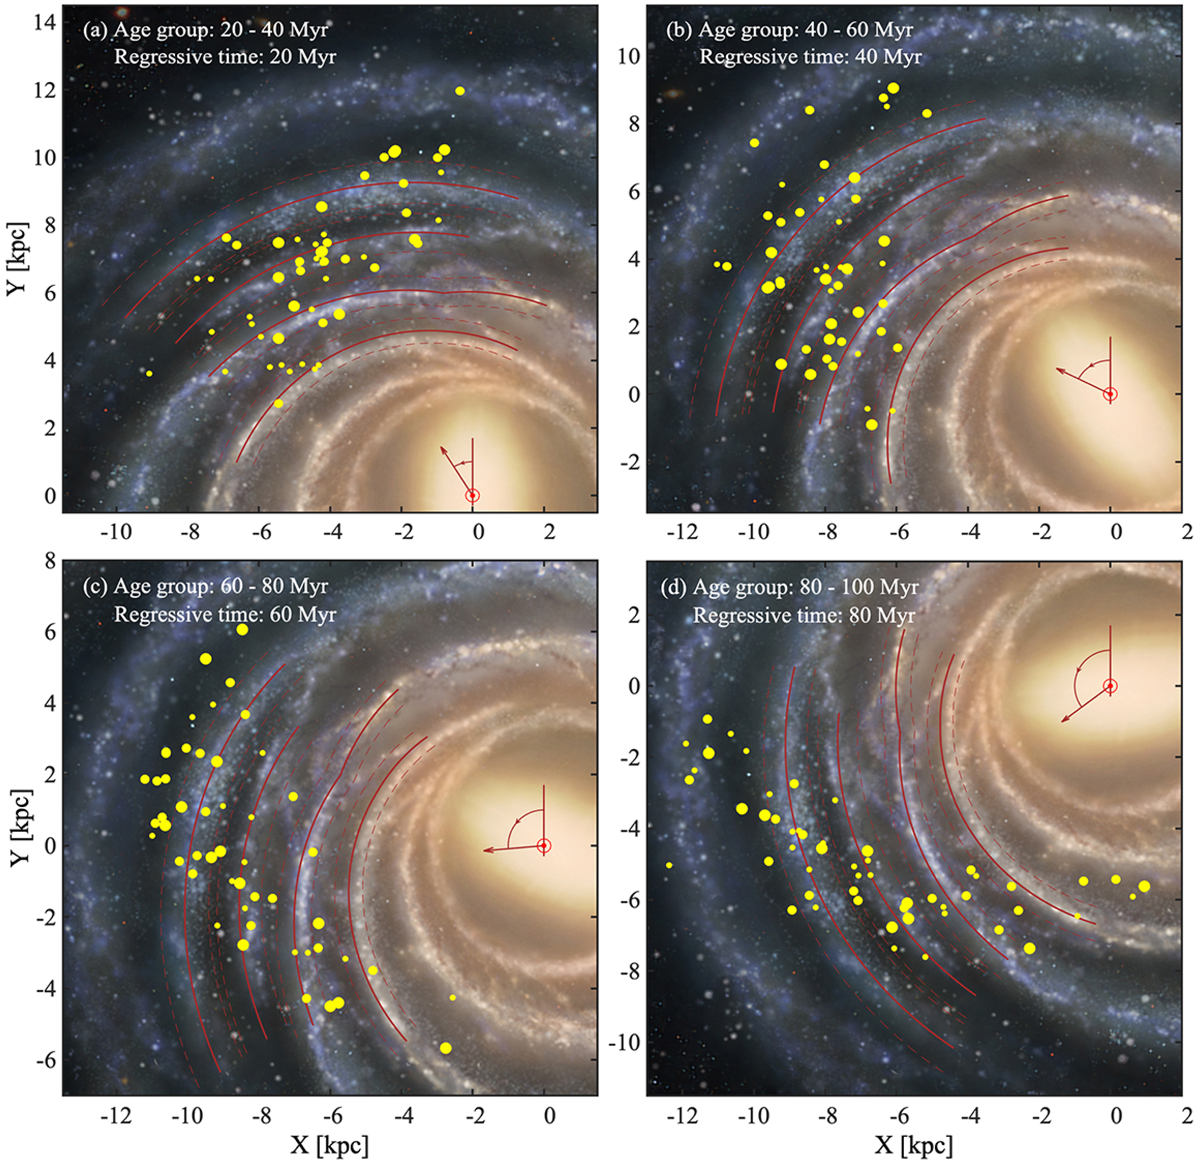
Distributions of the regressed OCs. The OC ages have been grouped into: (a) 20−40 Myr, (b) 40−60 Myr, (c) 60−80 Myr, (d) 80−100 Myr, and traced back to 20, 40, 60, and 80 million years ago, respectively. The solid curved lines trace the centres (and dotted lines the widths enclosing 90% of the masers) of the best-fit spiral arms given by Reid et al. (2019), and have been rigidly rotated back to the past for comparison. The background is a new concept map of the Milky Way (credited by: Xing-Wu Zheng & Mark Reid BeSSeL/NJU/CFA), which is also rigidly rotated back to the past. The adopted pattern speed is 27 km s−1 kpc−1.
Current usage metrics show cumulative count of Article Views (full-text article views including HTML views, PDF and ePub downloads, according to the available data) and Abstracts Views on Vision4Press platform.
Data correspond to usage on the plateform after 2015. The current usage metrics is available 48-96 hours after online publication and is updated daily on week days.
Initial download of the metrics may take a while.