Fig. 4.
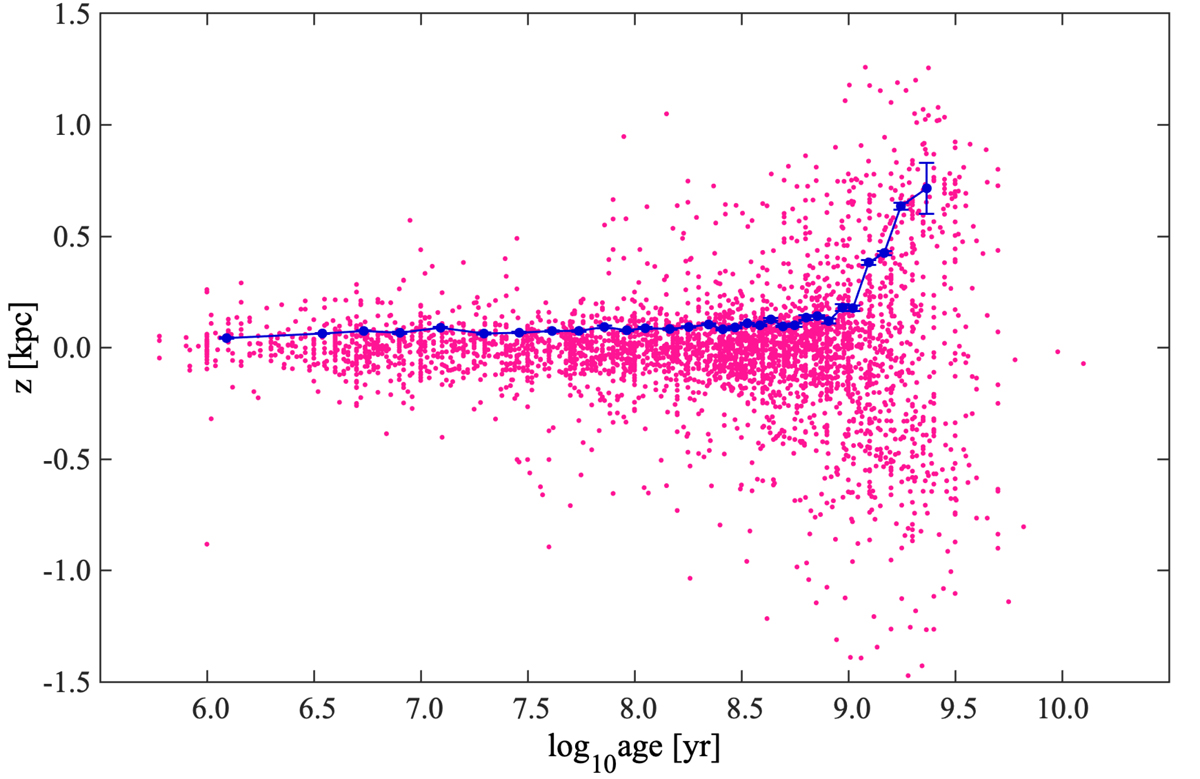
Evolution of the scale height of OCs with OC age. The 3376 OCs within 4.0 kpc of the Sun are divided into 32 bins according to their ages. The blue line indicates the evolution of the scale height with cluster age. The blue dots correspond to the typical values of log10(age) in each bin. The solid magenta dots show the distances of the OCs to the Galactic plane as a function of cluster age.
Current usage metrics show cumulative count of Article Views (full-text article views including HTML views, PDF and ePub downloads, according to the available data) and Abstracts Views on Vision4Press platform.
Data correspond to usage on the plateform after 2015. The current usage metrics is available 48-96 hours after online publication and is updated daily on week days.
Initial download of the metrics may take a while.