Fig. 1.
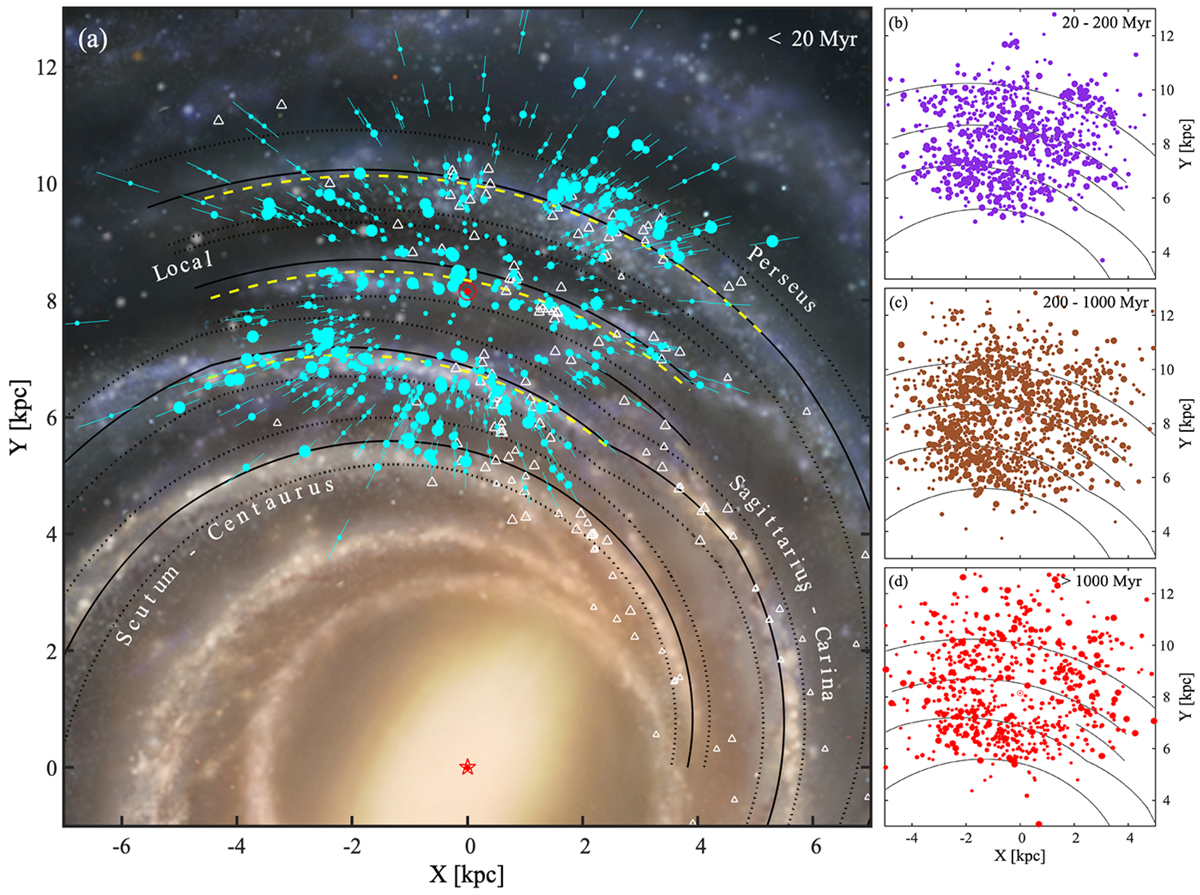
Distributions of Galactic OCs. (a) YOCs (cyan dots; ages < 20 Myr) and HMSFR masers (white triangles) projected onto the Galactic disc. The dot size is proportional to the number of cluster members. The solid curved lines trace the centres (and dotted lines the widths enclosing 90% of the masers) of the best-fit spiral arms given by Reid et al. (2019). The distance uncertainties of the masers are indicated by the inverse size of the symbols. The yellow dashed lines denote the best-fit spiral arm centres from the distribution of YOCs. The Galactic centre (red star) is at (0,0) kpc and the Sun (red symbol) is at (0, 8.15) kpc. The background is a new concept map of the Milky Way credited by Xing-Wu Zheng & Mark Reid BeSSeL/NJU/CFA. The distributions of the older clusters are shown in panels b–d for the OCs with ages of 20−200 Myr (purple dots), 200−1000 Myr (brown dots), and > 1000 Myr (red dots), respectively. The dot size is also proportional to the number of cluster members. The parallax uncertainties of the OCs shown are all smaller than 10%.
Current usage metrics show cumulative count of Article Views (full-text article views including HTML views, PDF and ePub downloads, according to the available data) and Abstracts Views on Vision4Press platform.
Data correspond to usage on the plateform after 2015. The current usage metrics is available 48-96 hours after online publication and is updated daily on week days.
Initial download of the metrics may take a while.