Fig. B.1
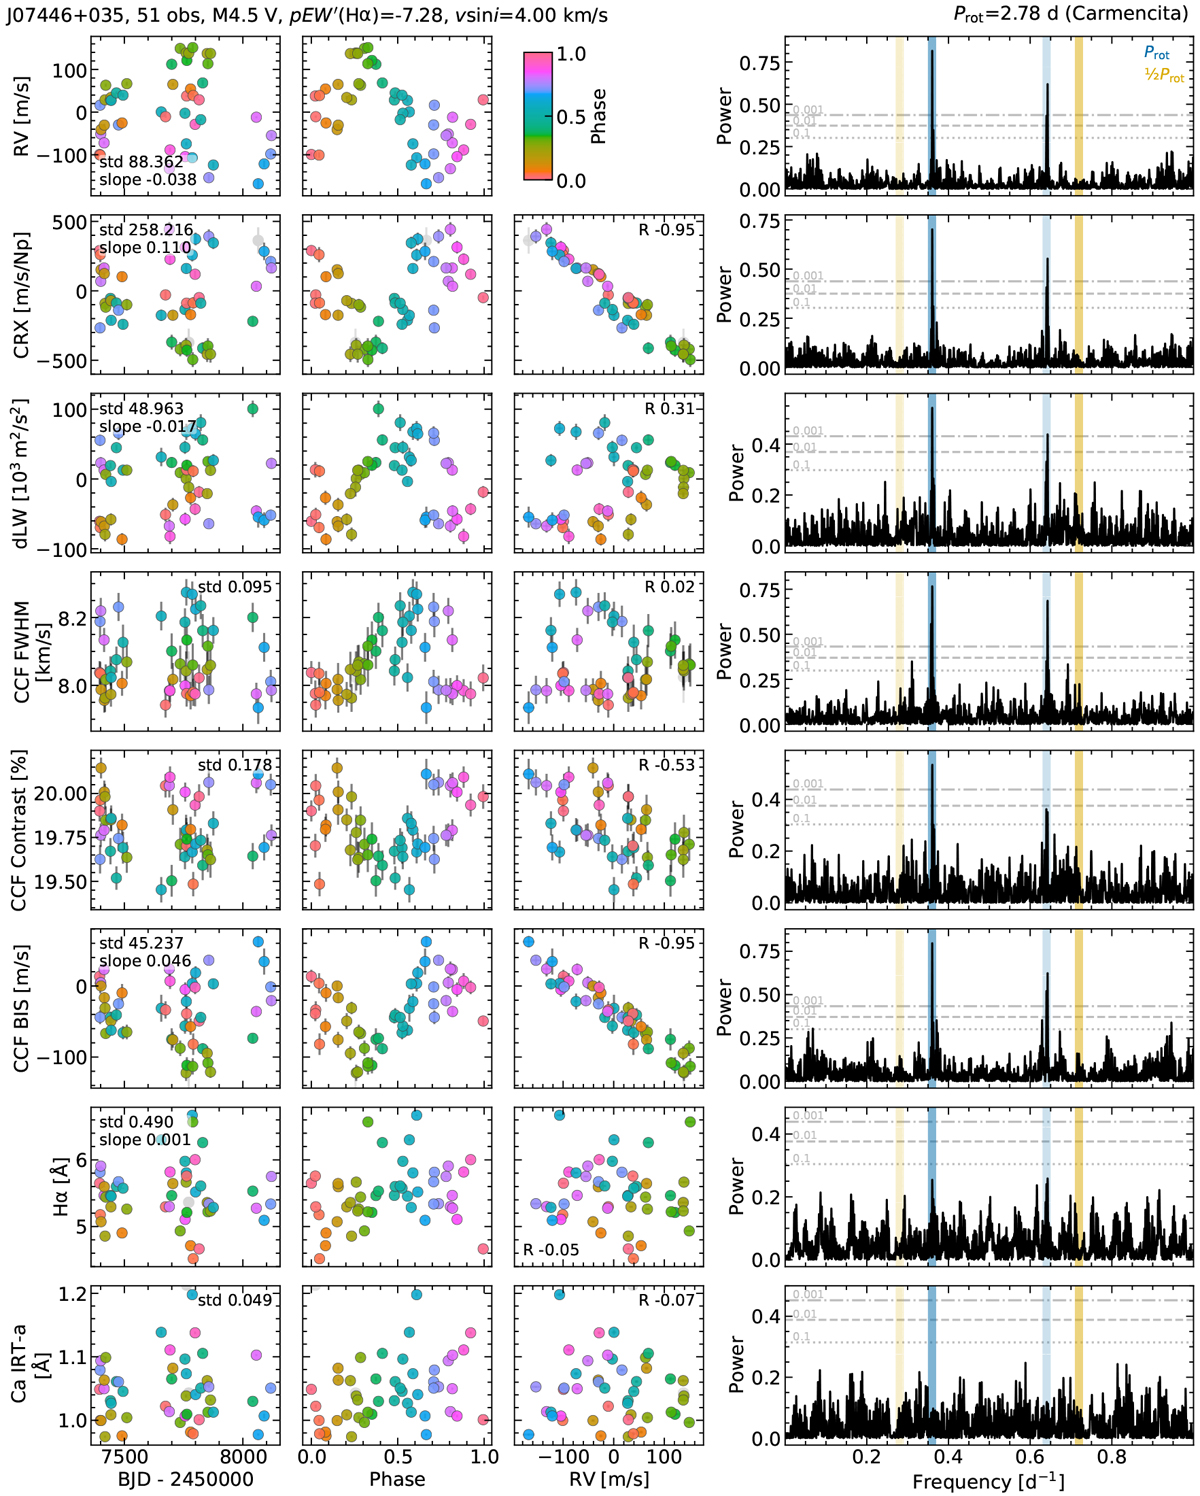
RV and indicator time series (left), data folded at Prot (middle left), correlation with the RV (middle right), and periodogram (right) of J07446+035 (YZ CMi, GJ 285). The parameters are, from top to bottom: corrected serval RV, CRX, dLW, CCF FWHM, CCF contrast, CCF BIS, Hα index, and Ca IRT-a index. We only show the first IRT line because the other two show very similar time series and periodograms with no significant signal. Each time series is corrected for a linear trend, and the periodograms are computed on nightly-averaged observations. Data points are colour-coded with the rotation phase, and outliers not considered are marked in grey (some outliers may be outside the data range shown). The text in the time series panels shows the standard deviation of the data (std) and the slope of the linear trend that is subtracted from the data (only slopes with absolute values ≥ 0.001). The text in the correlation panels indicates the Pearson correlation coefficient of the data (R). In the periodogram panels, horizontal grey lines indicate the FAP level at 10% (dotted), 1% (dashed), and 0.1% (dotted dashed), and coloured shaded regions indicate the location of Prot (blue), ![]() (yellow), and their 1-day aliases (lighter hatched regions).
(yellow), and their 1-day aliases (lighter hatched regions).
Current usage metrics show cumulative count of Article Views (full-text article views including HTML views, PDF and ePub downloads, according to the available data) and Abstracts Views on Vision4Press platform.
Data correspond to usage on the plateform after 2015. The current usage metrics is available 48-96 hours after online publication and is updated daily on week days.
Initial download of the metrics may take a while.