Fig. 4
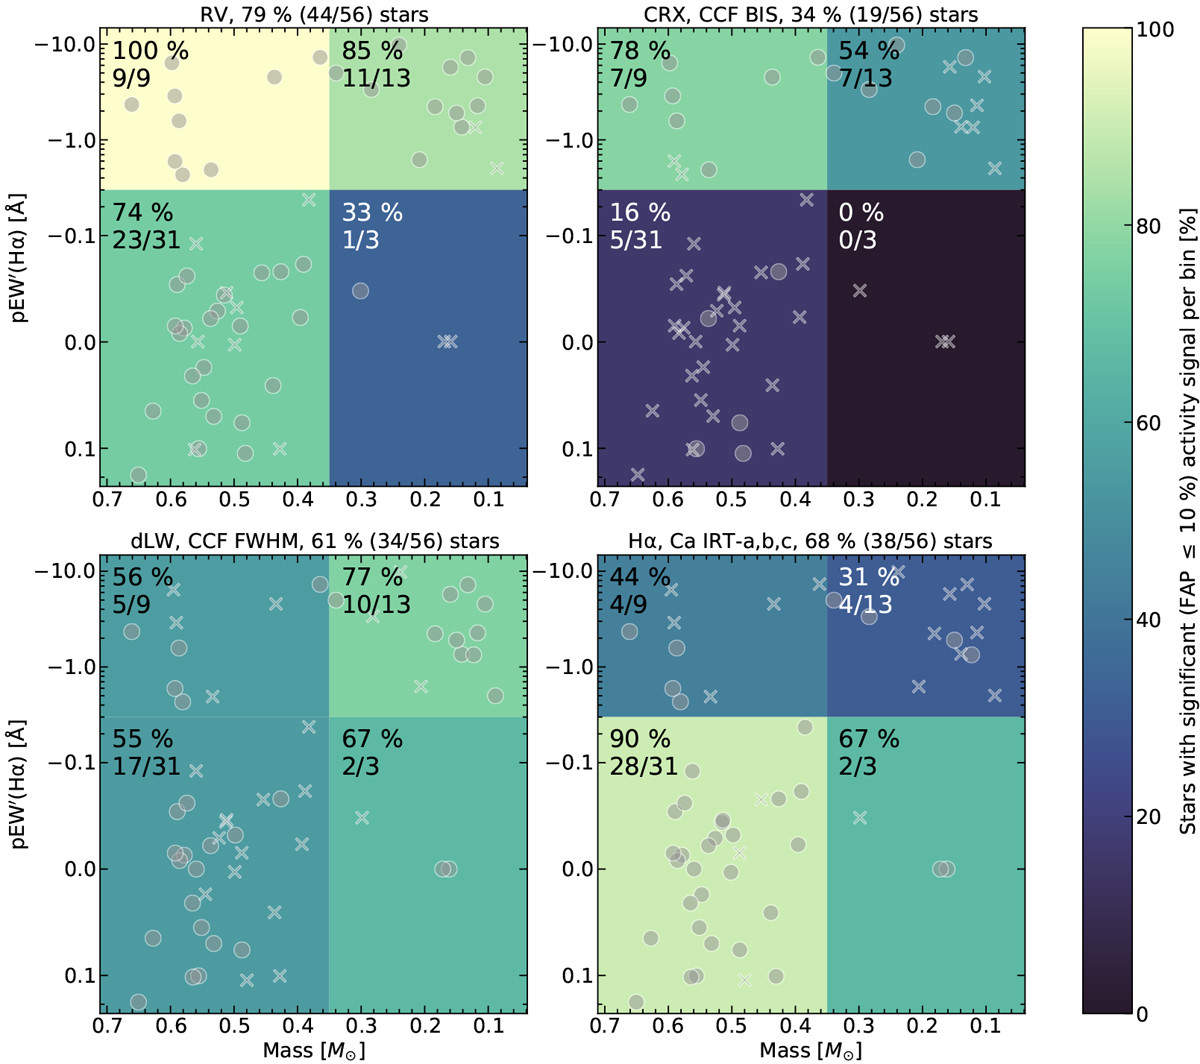
Number of stars with activity detections in RV (top left), CRX and BIS (top right), dLW and FWHM (bottom left), and chromospheric lines Hα and Ca IRT-a,b,c (bottom right). The stars are divided into four bins, depending on their average activity level and mass. Axes are the same as in Fig. 3. The colours of each bin indicate the number of stars (in percentage) for which we found an activity-related signal with FAP ≤ 10%. The text in each bin also shows that percentage, together with the absolute number of stars that have such a detection. The title of each panel shows the same numbers, but for all the stars (i.e. for the four bins together). Grey data points indicate the position of the 56 stars considered in the activity-mass space, with large circles representing the stars with a detection in the specific indicator, and crosses, stars with no detection.
Current usage metrics show cumulative count of Article Views (full-text article views including HTML views, PDF and ePub downloads, according to the available data) and Abstracts Views on Vision4Press platform.
Data correspond to usage on the plateform after 2015. The current usage metrics is available 48-96 hours after online publication and is updated daily on week days.
Initial download of the metrics may take a while.