Fig. 3
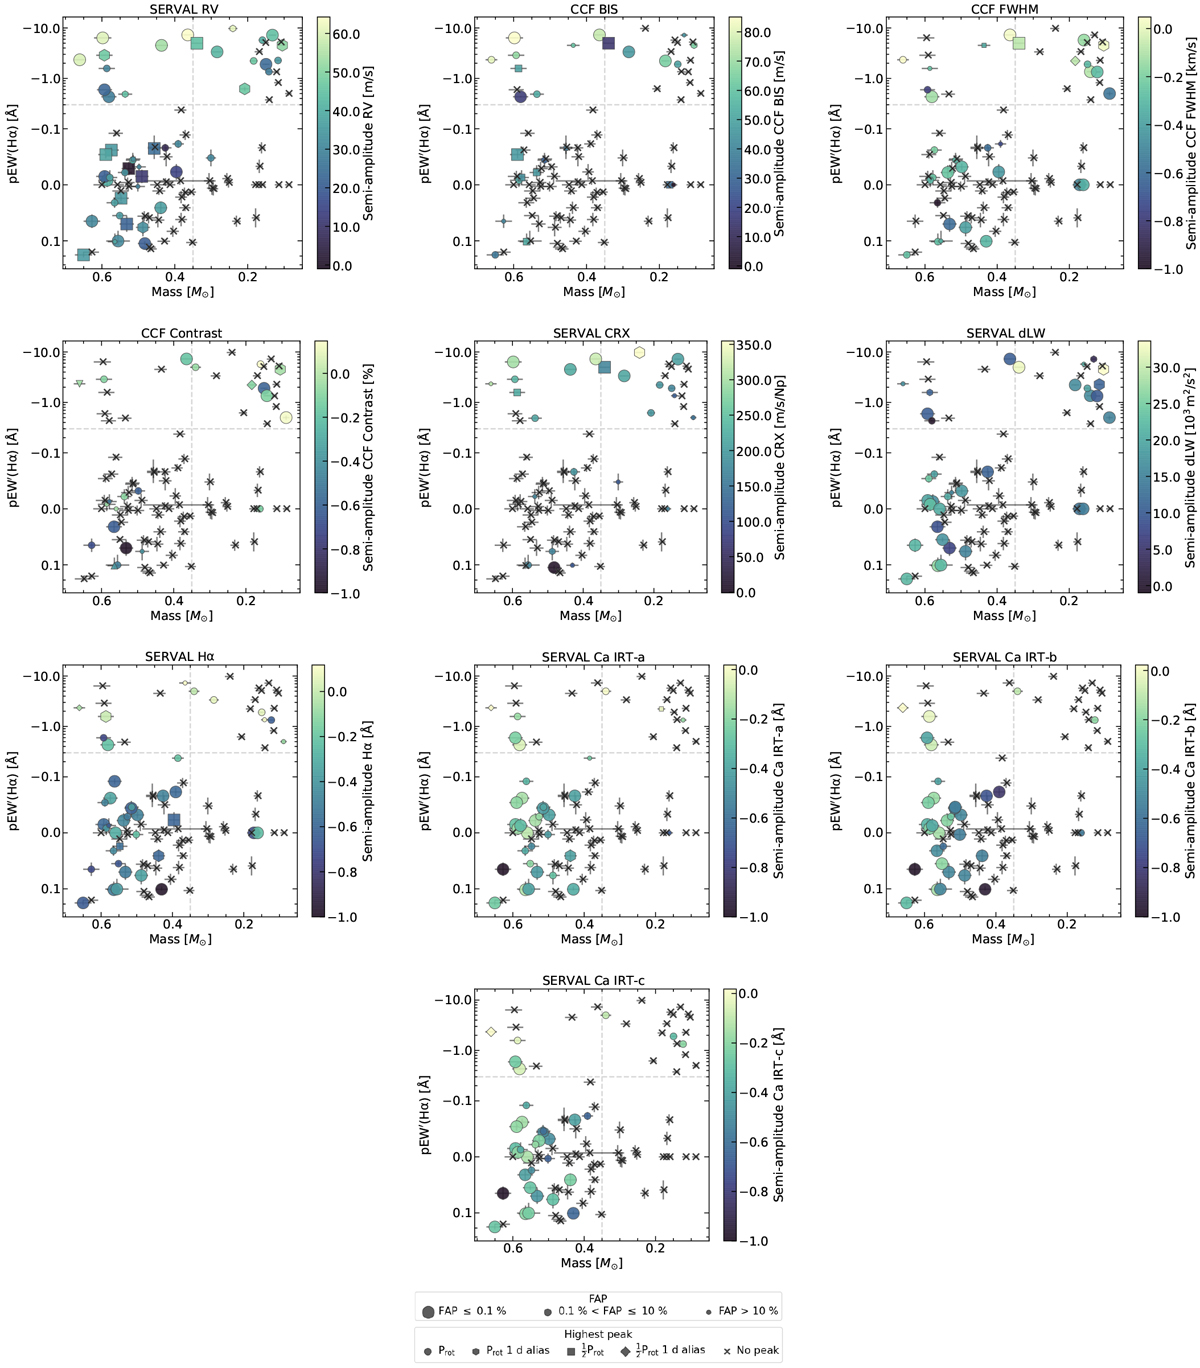
Activity detections in the 98 selected stars for the ten parameters analysed (left to right, top to bottom: RV, CCF BIS, CCF FWHM, CCF contrast, CRX, dLW, Hα, Ca IRT-a, b, and c). Stars are shown as a function of their average activity level (measured as the pEW′ (Hα) of the serval template) and mass. Different markers represent the activity signal with the smallest FAP identified in the periodogram of each star (circles correspond to Prot, hexagons to 1-day Prot alias, squares to ![]() , diamonds to 1-day
, diamonds to 1-day ![]() alias, and crosses indicate that no activity-related peak was found). Symbol sizes indicate the FAP value of the corresponding peak (larger size means smaller FAP), and the points are colour coded as a function of the semi-amplitude of the best-fitting sinusoid to the corresponding period.
alias, and crosses indicate that no activity-related peak was found). Symbol sizes indicate the FAP value of the corresponding peak (larger size means smaller FAP), and the points are colour coded as a function of the semi-amplitude of the best-fitting sinusoid to the corresponding period.
Current usage metrics show cumulative count of Article Views (full-text article views including HTML views, PDF and ePub downloads, according to the available data) and Abstracts Views on Vision4Press platform.
Data correspond to usage on the plateform after 2015. The current usage metrics is available 48-96 hours after online publication and is updated daily on week days.
Initial download of the metrics may take a while.