Free Access
Fig. B.5
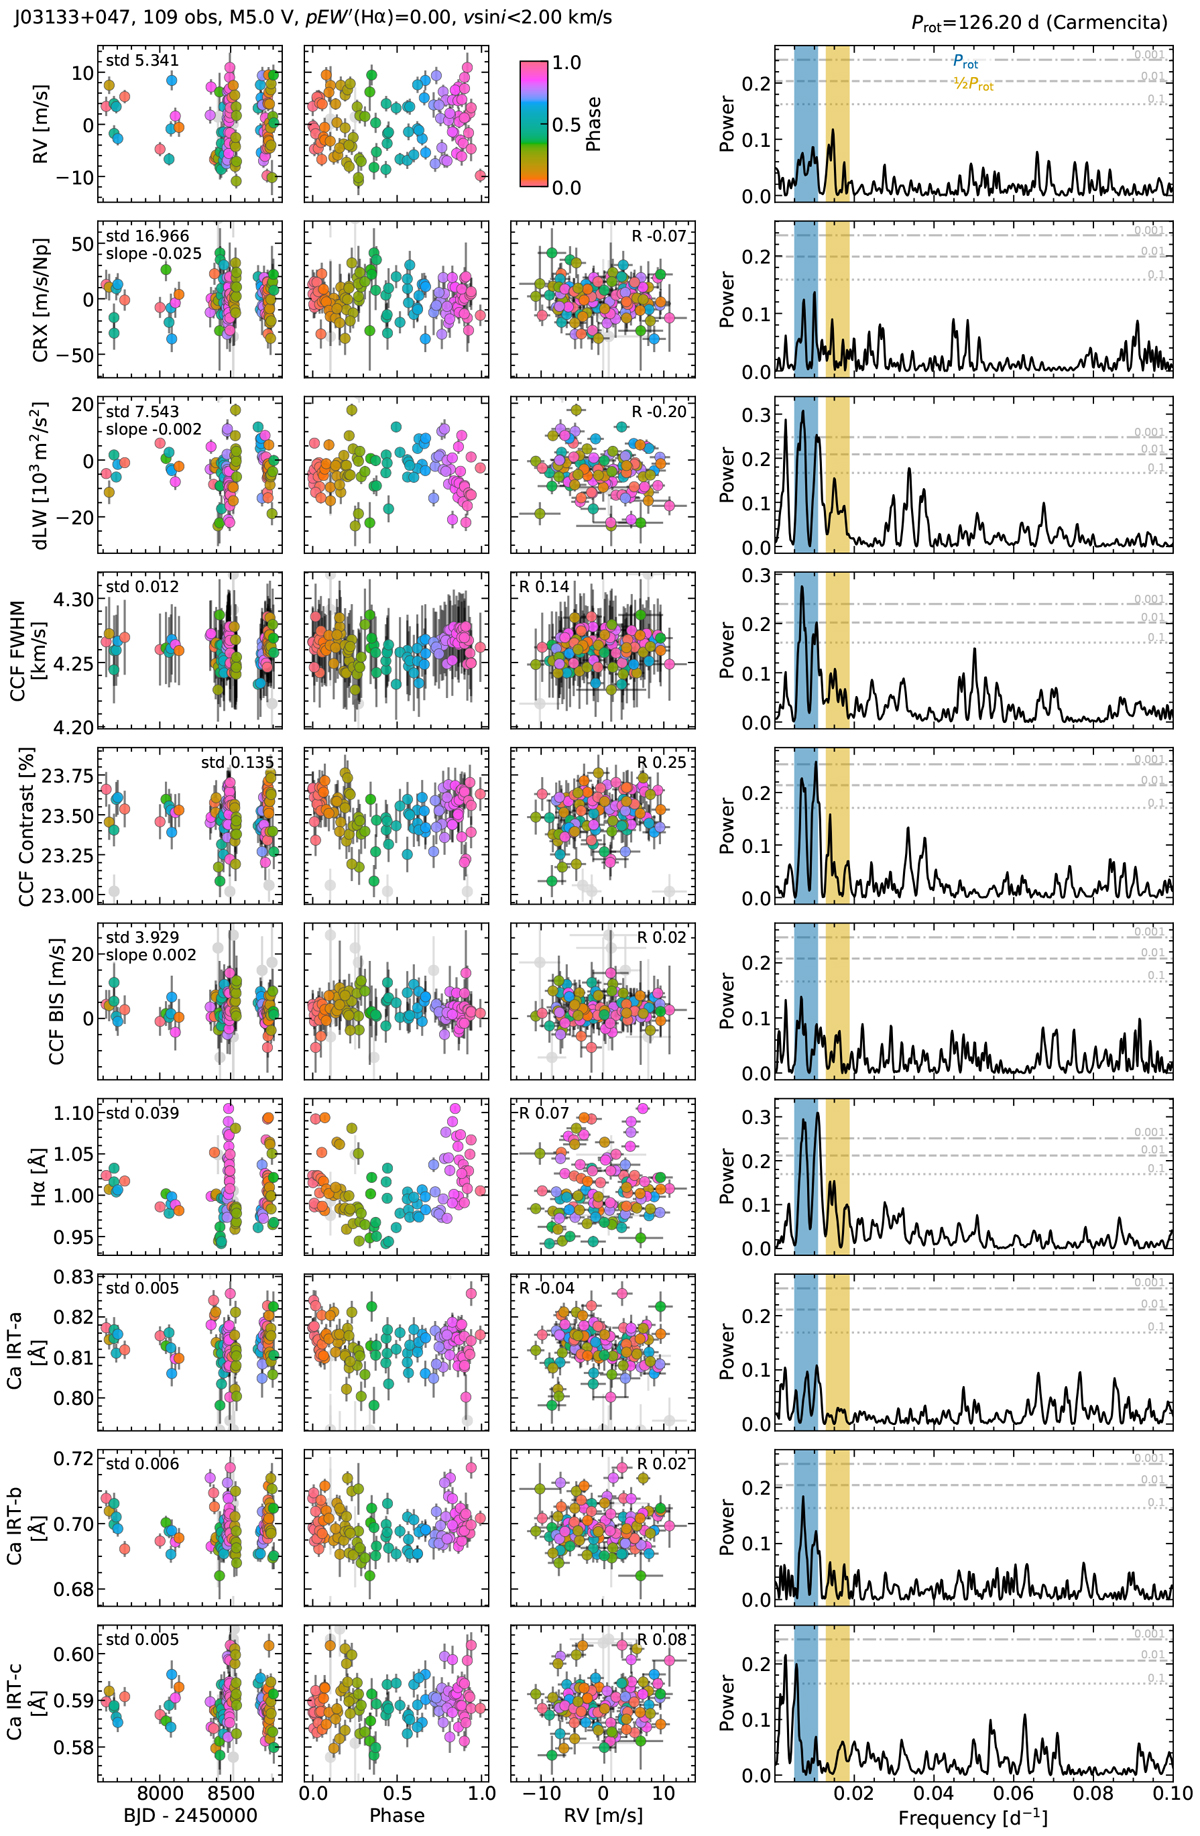
Same as Fig. B.1, but for J03133+047 (CD Cet, GJ 1057). In this case, the periodogram shows a zoom in at the low frequency range, where we find activity-related peaks (the planetary companion shows a significant peak in the RVs at 2.29 d = 0.44 d−1, not shown here).
Current usage metrics show cumulative count of Article Views (full-text article views including HTML views, PDF and ePub downloads, according to the available data) and Abstracts Views on Vision4Press platform.
Data correspond to usage on the plateform after 2015. The current usage metrics is available 48-96 hours after online publication and is updated daily on week days.
Initial download of the metrics may take a while.