Fig. 5.
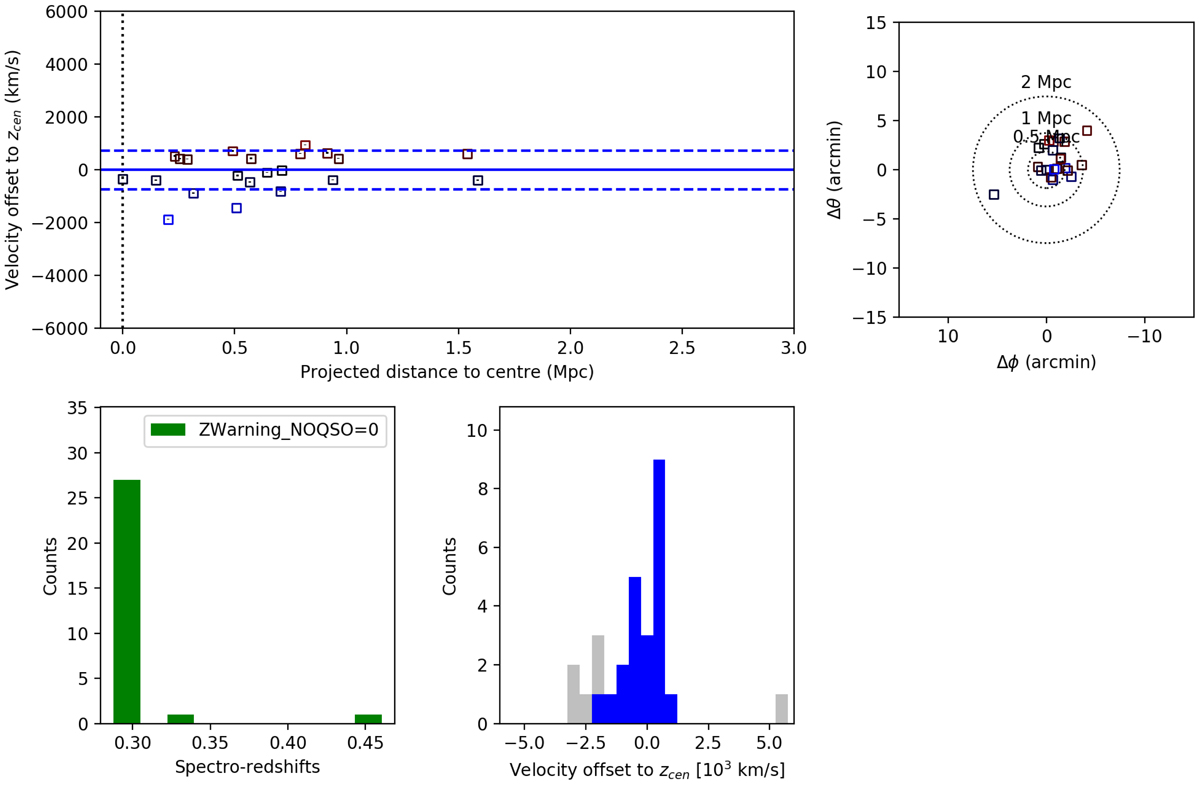
Spectroscopic redshift validation of a cluster using SPIDERS follow-up observations, as described in Sect. 4.1.3. Top-left panel: distribution of red-sequence galaxies in Xclass0842 as a function of their projected distance to the X-ray centroid and the velocity offset to the mean cluster redshift. Blue dashed lines indicate the standard deviation of the velocity distribution. Top-right panel: location of those members projected on the sky, with a similar colour-coding as in the previous panel. Lower-left histogram: redshift distribution of galaxies in the red sequence with an associated spectroscopic measurement. Lower-right histogram: distribution of members (in blue) and non-members (in grey).
Current usage metrics show cumulative count of Article Views (full-text article views including HTML views, PDF and ePub downloads, according to the available data) and Abstracts Views on Vision4Press platform.
Data correspond to usage on the plateform after 2015. The current usage metrics is available 48-96 hours after online publication and is updated daily on week days.
Initial download of the metrics may take a while.