Fig. 9.
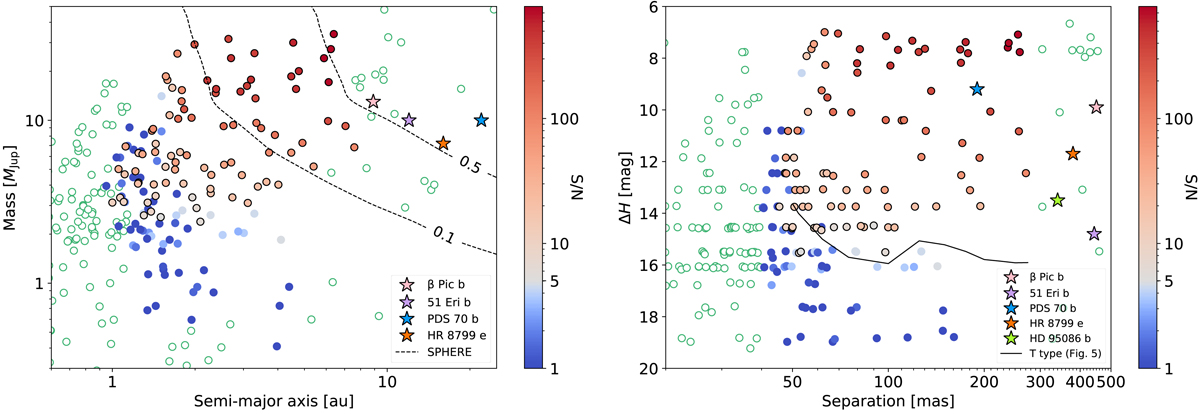
Results of our detection simulation based on population synthesis models, using the H-high configuration, on a semi-major axis and mass space (left) and separation and contrast space (right). The blue- to red-filled dots are the simulated companions, colored according to their S/N. The transition from blue to red is set at 5σ to highlight the detection limit. The companions detected over 5σ are further circled in black for clarity, and the green empty dots show the remaining companions of the population that were not simulated (see text for details). Some known companions are included for comparison. In addition, we show in the left plot the 10% and 50% detection probability curves of the VLT/SPHERE SHINE survey from Vigan et al. (2021). In the right plot, we overlay the T-type detection limit in H-high from Fig. 5.
Current usage metrics show cumulative count of Article Views (full-text article views including HTML views, PDF and ePub downloads, according to the available data) and Abstracts Views on Vision4Press platform.
Data correspond to usage on the plateform after 2015. The current usage metrics is available 48-96 hours after online publication and is updated daily on week days.
Initial download of the metrics may take a while.