Fig. 5.
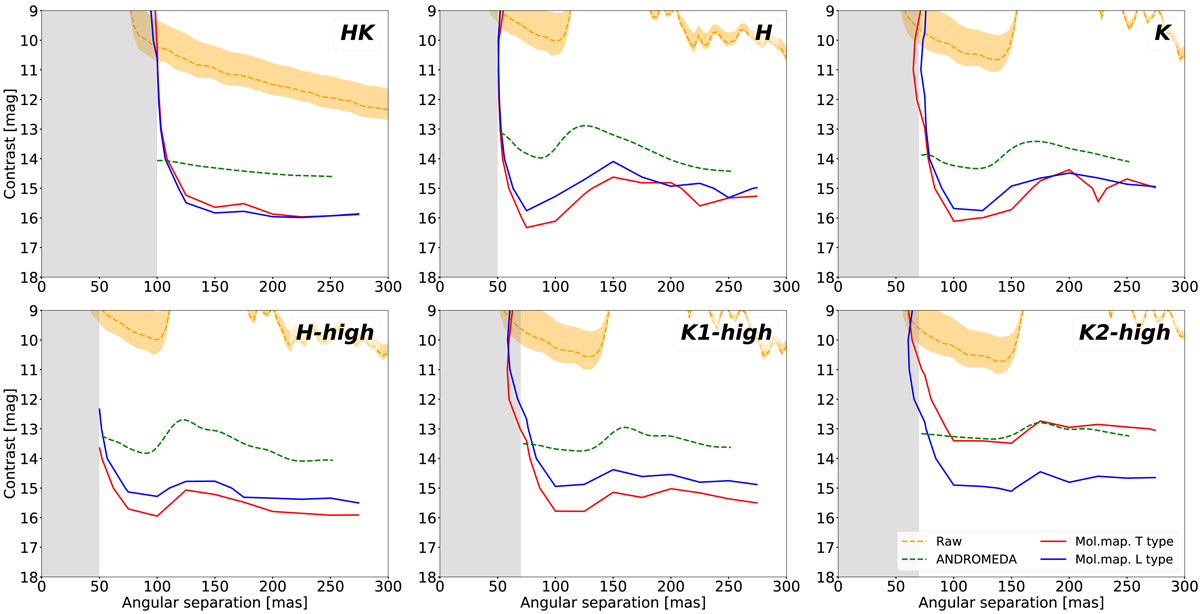
Detection limits of the HARMONI high-contrast mode for the six spectral configurations and the two types of injected companions. The red and blue curves show the 5-σ sensitivity to the T-type and L-type companions, respectively. The dashed green curves show the 5-σ sensitivity from the processing using the classical angular differential imaging algorithm ANDROMEDA. The orange dashed curves show the raw HARMONI contrasts before any processing, with the envelope representing the 1σ variance of the 120 exposures. The grayed-out part corresponds to the area masked by the anti-saturation focal plane mask.
Current usage metrics show cumulative count of Article Views (full-text article views including HTML views, PDF and ePub downloads, according to the available data) and Abstracts Views on Vision4Press platform.
Data correspond to usage on the plateform after 2015. The current usage metrics is available 48-96 hours after online publication and is updated daily on week days.
Initial download of the metrics may take a while.