Fig. 4.
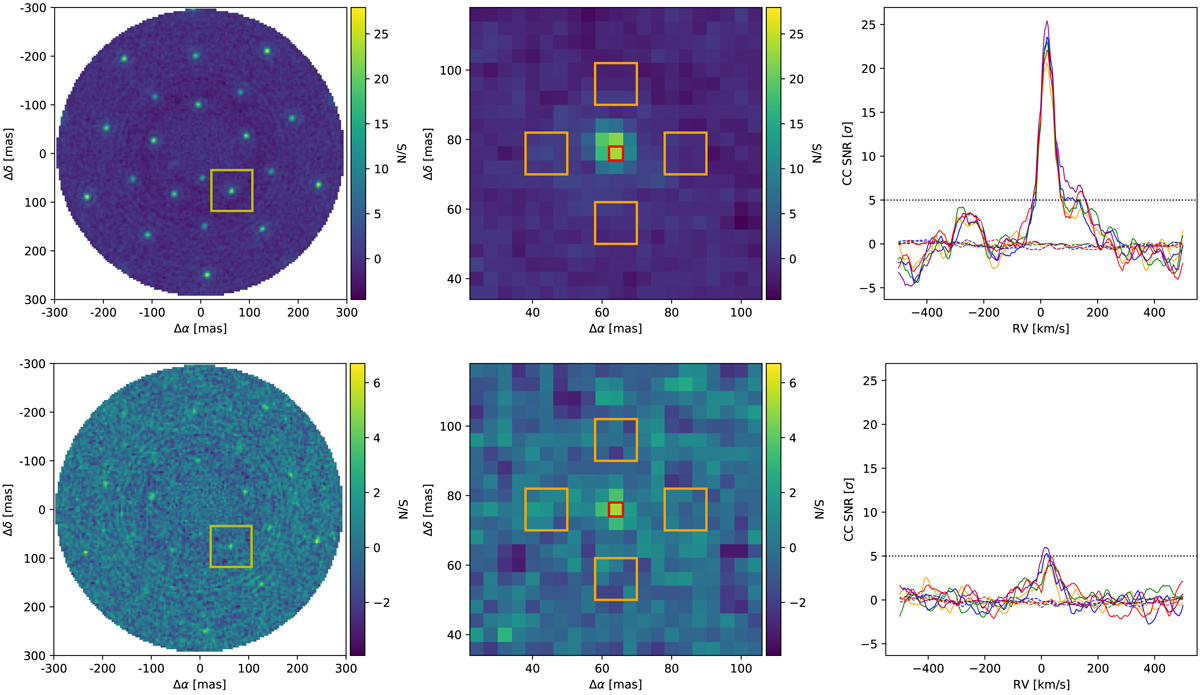
Cross-correlation maps (left) for the H-high configuration with T-type companions at ΔH = 14 (top) and 16 mag (bottom). The central images show enlarged regions around one of the companions at 100 mas, indicated by the yellow squares in the left images. In the right plots we show the corresponding cross-correlation functions (CCF) of this companion and others at same separation, in different colors. The plain lines show the CCFs at the position of injection of the companions (red square in the central image), while the dashed lines show the average CCFs in their neighborhood (taken in the orange squares in the central image). The black dotted line shows the 5-σ detection threshold.
Current usage metrics show cumulative count of Article Views (full-text article views including HTML views, PDF and ePub downloads, according to the available data) and Abstracts Views on Vision4Press platform.
Data correspond to usage on the plateform after 2015. The current usage metrics is available 48-96 hours after online publication and is updated daily on week days.
Initial download of the metrics may take a while.