Open Access
Fig. 1.
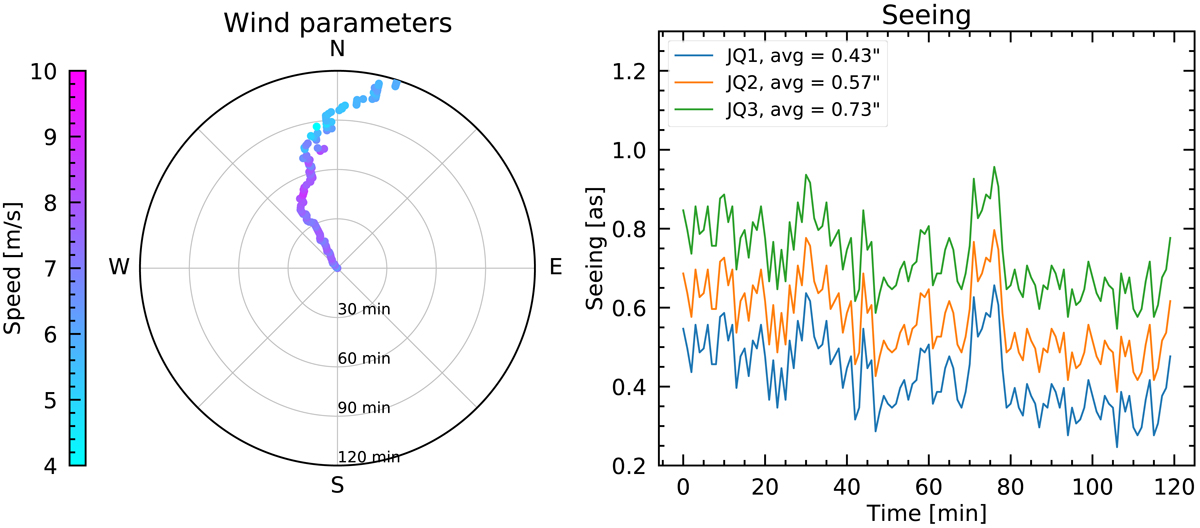
Atmospheric conditions simulated for each exposure. The left plot provides the ground layer wind speed and direction and the right plot shows the seeing values for three different predefined conditions, which are labeled JQ1, JQ2, and JQ3 (see text for details).
Current usage metrics show cumulative count of Article Views (full-text article views including HTML views, PDF and ePub downloads, according to the available data) and Abstracts Views on Vision4Press platform.
Data correspond to usage on the plateform after 2015. The current usage metrics is available 48-96 hours after online publication and is updated daily on week days.
Initial download of the metrics may take a while.