Fig. 13.
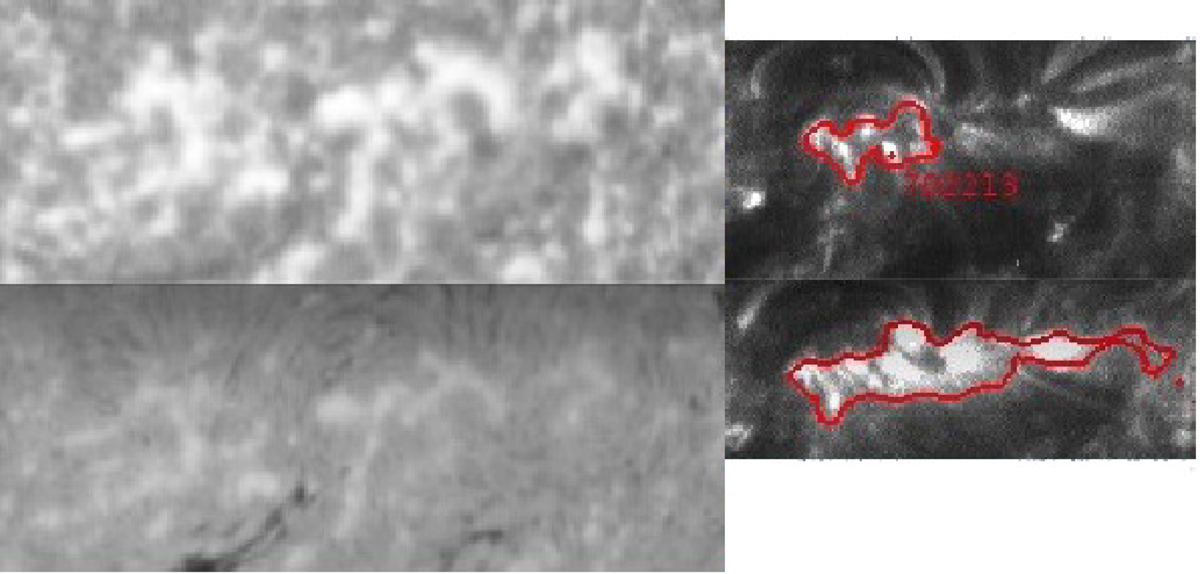
Left panel: upper thumbnail shows an AR in high chromosphere (center of Ca II K3 line), while the lower one shows the same region at the same time, in low chromosphere (Hα line). Right panel: same active region, in low corona, on 2001-07-03 (upper image) and on 2001-07-04 (lower image). Left observations were realized with the Meudon spectroheliograph and are available in BASS2000. Right observations come from the SOHO/EIT instrument and are available at NASA. Automatic detections come from Barra et al. (2009).
Current usage metrics show cumulative count of Article Views (full-text article views including HTML views, PDF and ePub downloads, according to the available data) and Abstracts Views on Vision4Press platform.
Data correspond to usage on the plateform after 2015. The current usage metrics is available 48-96 hours after online publication and is updated daily on week days.
Initial download of the metrics may take a while.