Fig. 7
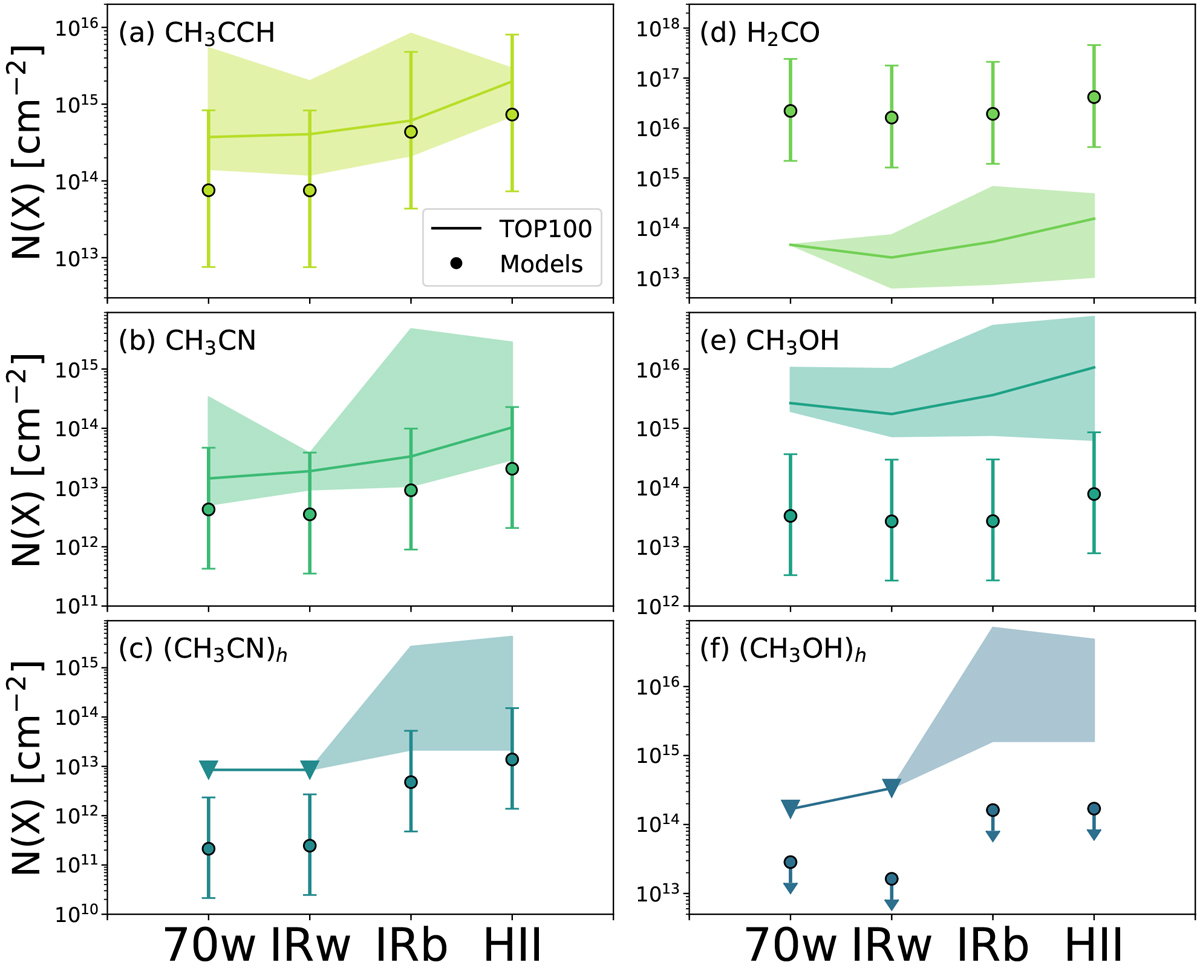
Comparison of the median column densities observed in the TOP100 (solid lines) with those predicted by our models (circles) that were obtained by applying the same procedure as was used to quantify Δtphase (see Sect. 4.2). Panels are separated by tracers (colours). The shape of the shaded areas indicates the minimum and maximum observed column density, and the error bars associated with each circle incorporate the uncertainty of one order of magnitude assumed in Eq. (6) for the comparison. The modelled column densities of the hot component of methanol (circles in panel f) are multiplied by a factor 1000. Triangles indicate the upper limits. The column densities are shown in log-scale.
Current usage metrics show cumulative count of Article Views (full-text article views including HTML views, PDF and ePub downloads, according to the available data) and Abstracts Views on Vision4Press platform.
Data correspond to usage on the plateform after 2015. The current usage metrics is available 48-96 hours after online publication and is updated daily on week days.
Initial download of the metrics may take a while.