Fig. 6
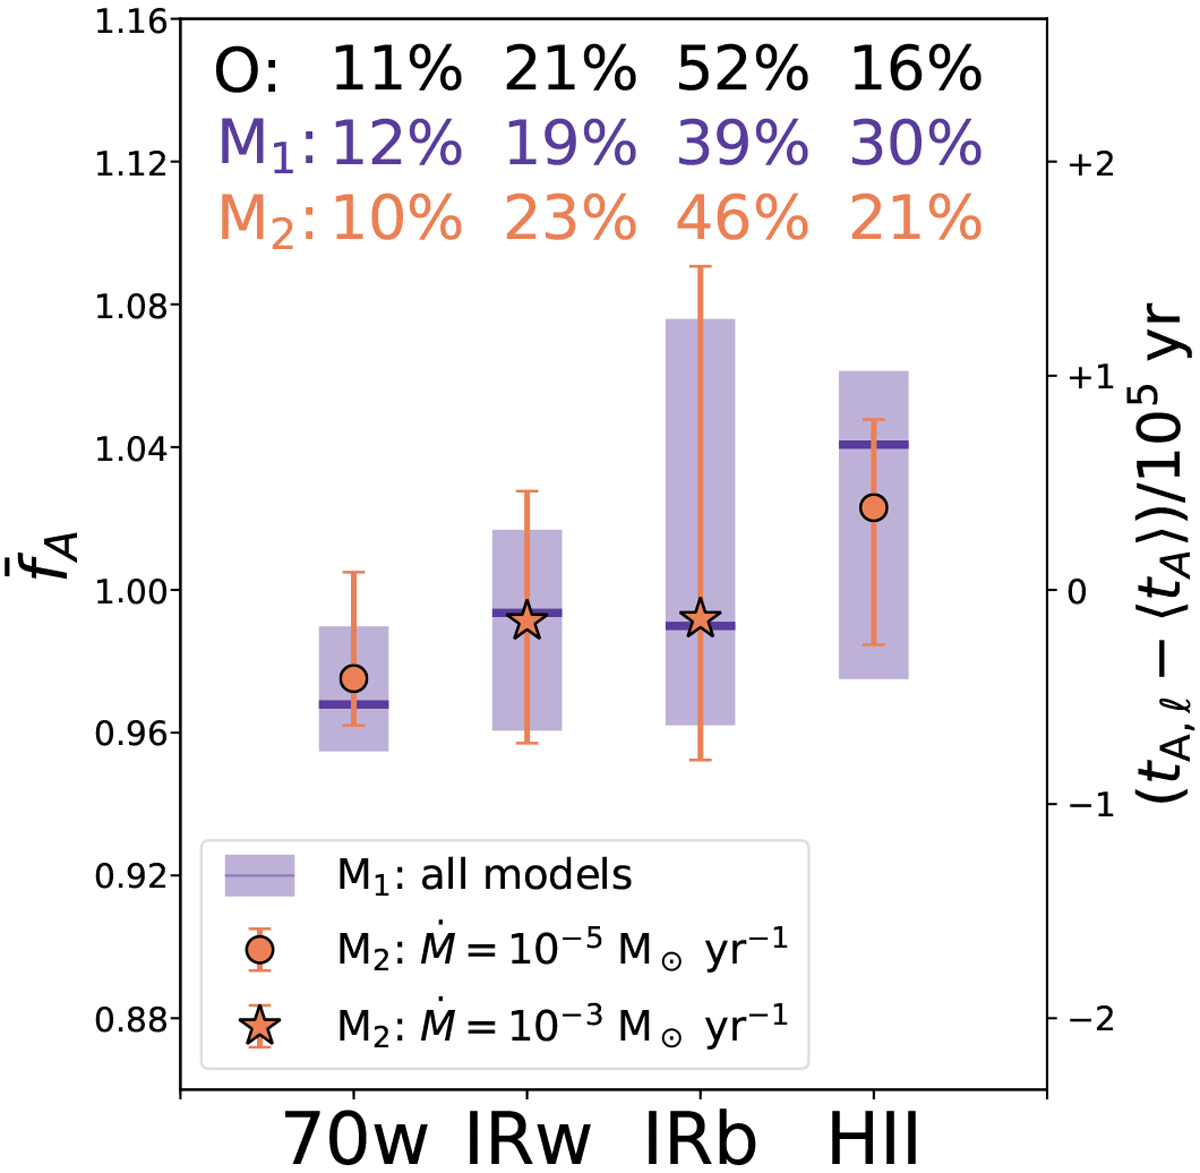
Summary of the final durations estimated in each evolutionary class defined for the TOP100. The relative number of massive clumps in each phase and observed in ATLASGAL are shown in black (“O”; Urquhart et al. 2018). Purple shaded areas indicate the 5th and 95th percentiles of the age factor, fA, and the corresponding value in yr in our sample (model “M1”), and purple markers (‘–’) represent their medians. The numbers associated with the model “M2 ” (orange), indicate the same quantities obtained by separating the models with respect to Ṁ before calculating the average age of each source (see text). The different markers in M2 show the combination of Ṁ that best match the observed relative number of object in each phase (legend).
Current usage metrics show cumulative count of Article Views (full-text article views including HTML views, PDF and ePub downloads, according to the available data) and Abstracts Views on Vision4Press platform.
Data correspond to usage on the plateform after 2015. The current usage metrics is available 48-96 hours after online publication and is updated daily on week days.
Initial download of the metrics may take a while.