Fig. 5
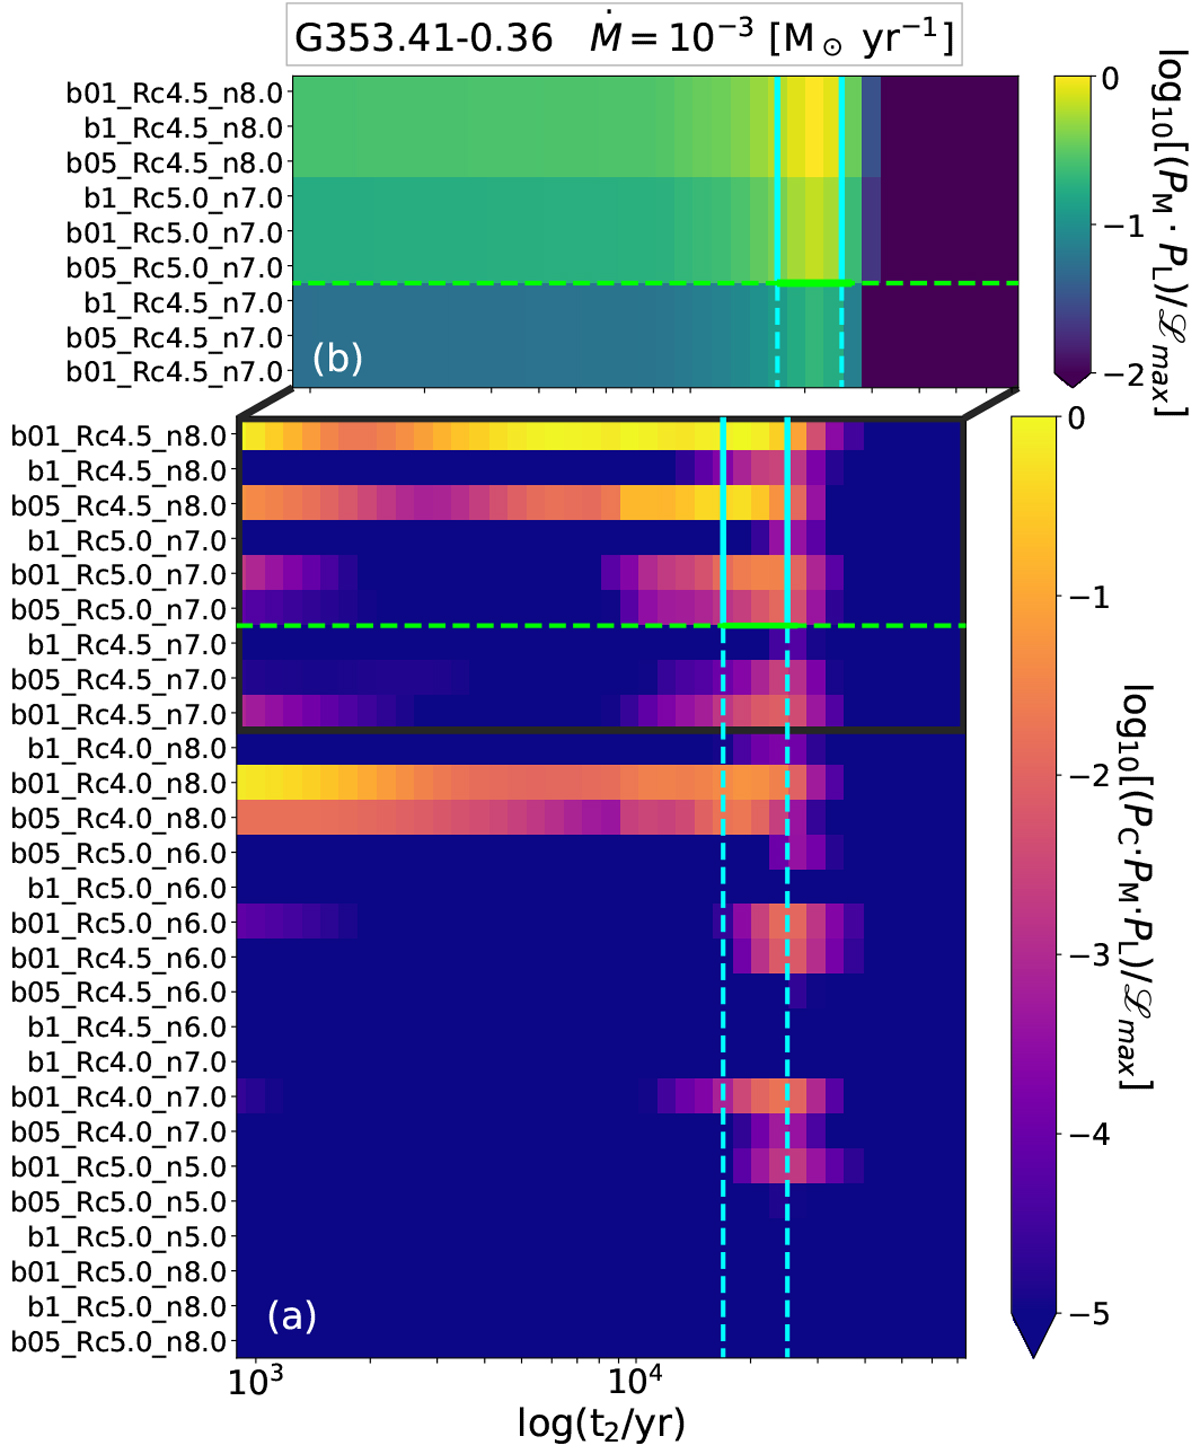
Panel a: example of the ![]() matrix calculated for G353.41-0.36 in all the models with Ṁ = 10−3M⊙ yr−1. Models on the y-axis are sorted from the top to the bottom by the difference between the mass of the models (see Table 2) and the value associated in the TOP100 (see Table D.1). For the sake of clarity, the colour bar is limited to five orders of magnitude and is normalised to maximum likelihood (
matrix calculated for G353.41-0.36 in all the models with Ṁ = 10−3M⊙ yr−1. Models on the y-axis are sorted from the top to the bottom by the difference between the mass of the models (see Table 2) and the value associated in the TOP100 (see Table D.1). For the sake of clarity, the colour bar is limited to five orders of magnitude and is normalised to maximum likelihood (![]() ). Panel b: zoom on the age limits identified by PL and PM showing howthe likelihood would appear if PC in Eq. (4) were not taken into account. Cyan vertical lines indicate the range of time that corresponds to the uncertainties on the observed luminosity in the TOP100, and the horizontal green line shows the same limit associated with the clump mass. Times and
). Panel b: zoom on the age limits identified by PL and PM showing howthe likelihood would appear if PC in Eq. (4) were not taken into account. Cyan vertical lines indicate the range of time that corresponds to the uncertainties on the observed luminosity in the TOP100, and the horizontal green line shows the same limit associated with the clump mass. Times and
![]() are shown in log-scale.
are shown in log-scale.
Current usage metrics show cumulative count of Article Views (full-text article views including HTML views, PDF and ePub downloads, according to the available data) and Abstracts Views on Vision4Press platform.
Data correspond to usage on the plateform after 2015. The current usage metrics is available 48-96 hours after online publication and is updated daily on week days.
Initial download of the metrics may take a while.