Fig. 4
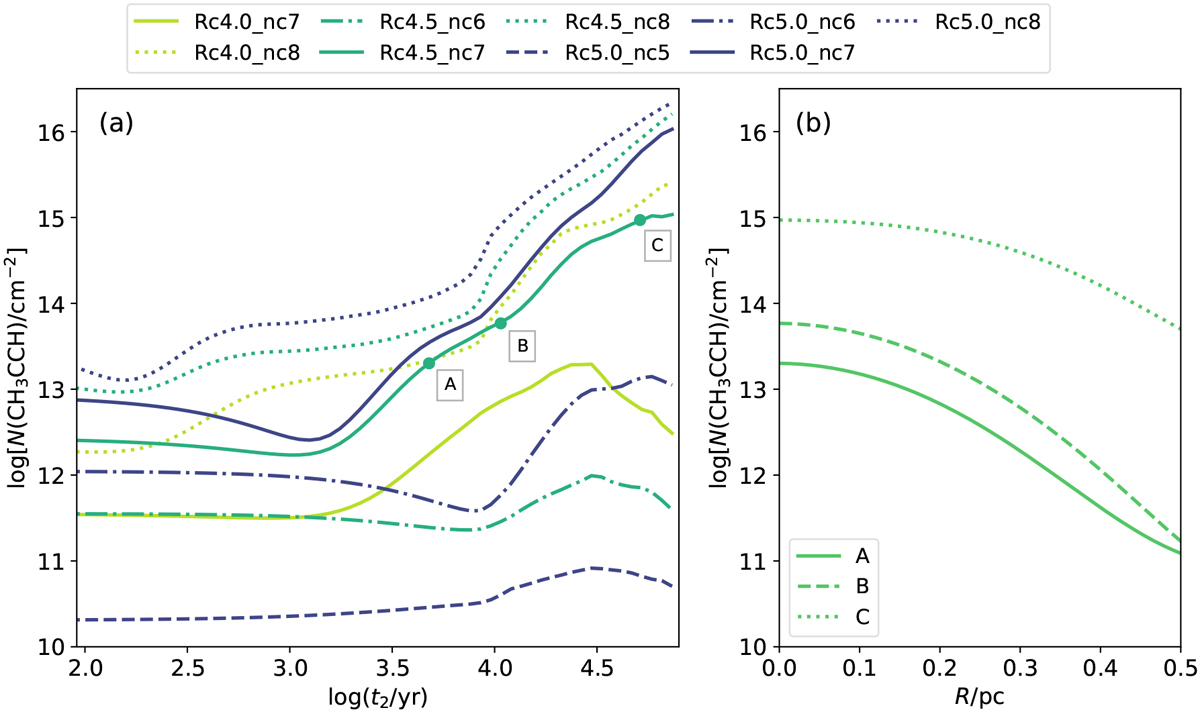
Panel a: exampleof the LOS gas-phase column density profiles obtained at the end of the post-processing described in Sect. 4.1 for models with b = 1 and Ṁ = 10−3M⊙ yr−1 and for an arbitrarily chosen source at a distance of 3.5 kpc. For the U_W items in the legend, U and W are Rc (colours) and nH(r0) (styles), respectively. Panel b: radial distribution of the gas-phase column densities extracted at the positions A, B, and C in panel a, i.e. the same times as in Fig. 2.
Current usage metrics show cumulative count of Article Views (full-text article views including HTML views, PDF and ePub downloads, according to the available data) and Abstracts Views on Vision4Press platform.
Data correspond to usage on the plateform after 2015. The current usage metrics is available 48-96 hours after online publication and is updated daily on week days.
Initial download of the metrics may take a while.