Fig. 3
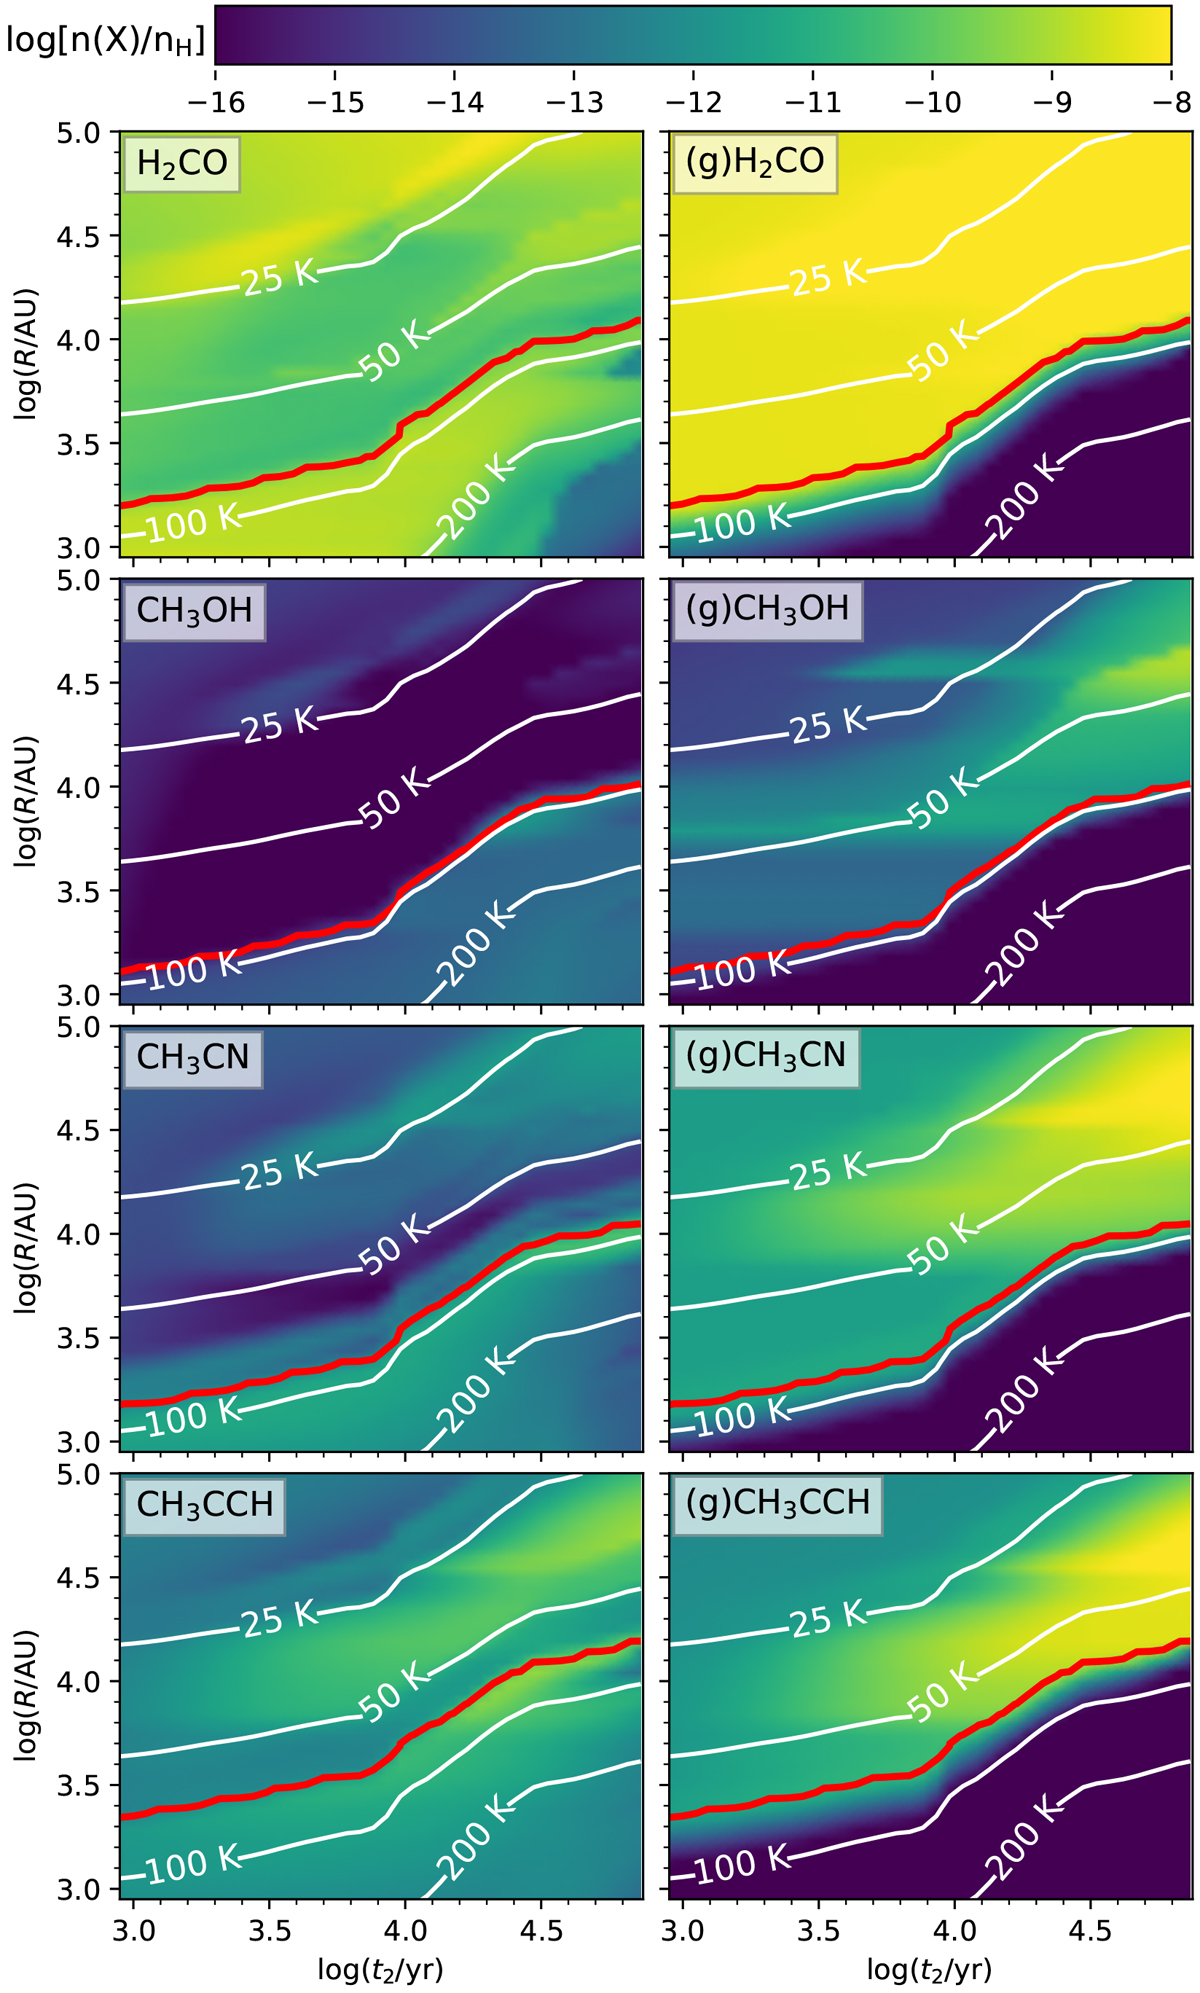
Temporal and radial evolution of the abundances of the tracers observed in the TOP100 (Giannetti et al. 2017; Tang et al. 2018) during phase II in the gas phase (left panels) and on dust (right panels) for the same reference model as in Fig. 2. White contours indicate the temperature computed with MOCASSIN. Red curves corresponds to the evaporation front of the given tracer.
Current usage metrics show cumulative count of Article Views (full-text article views including HTML views, PDF and ePub downloads, according to the available data) and Abstracts Views on Vision4Press platform.
Data correspond to usage on the plateform after 2015. The current usage metrics is available 48-96 hours after online publication and is updated daily on week days.
Initial download of the metrics may take a while.