Fig. 1
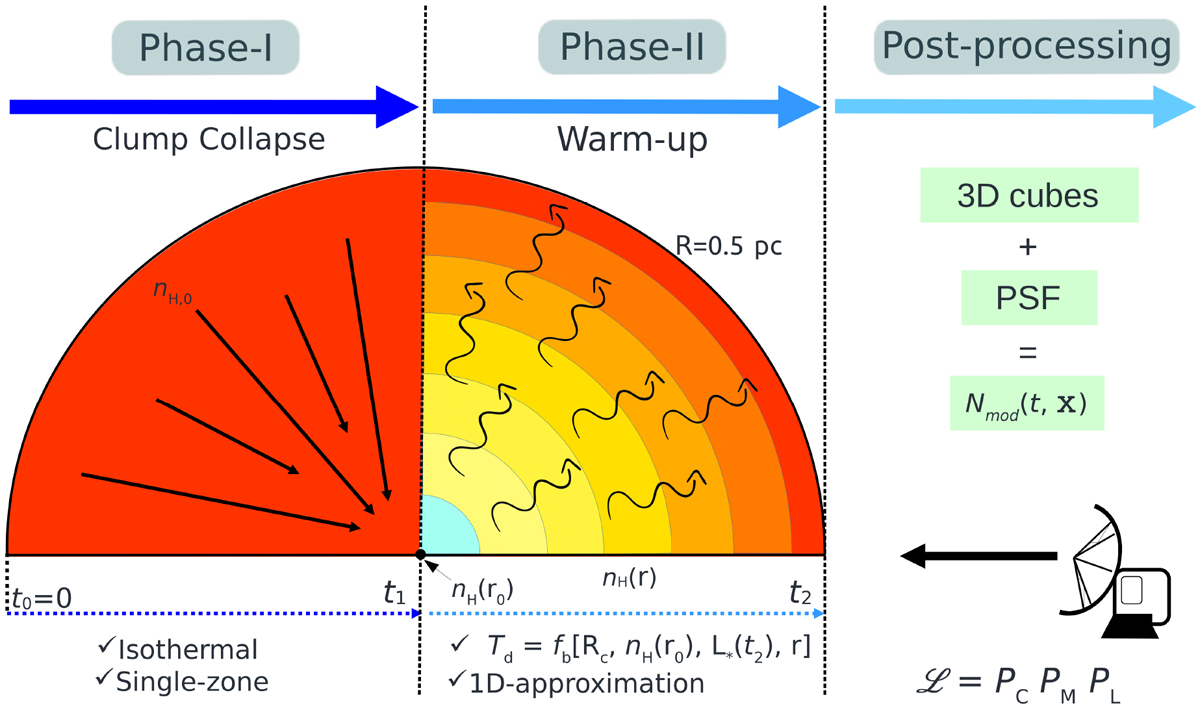
Sketch of the physical model employed in this work. Left panel: collapse phase (see Sect. 3.1.1) solved in a single-zone approximation. The chemical output of phase I is used as initial condition of phase II. Central panel: warm-up phase solved in a 1D approximation from 1 to 105 AU (see Sect. 3.1.2). Right panel: post-processing applied to compare the final chemical outputs of phase II with the column densities observed in the TOP100 (see Sects. 4.1 and 4.2). The physical parameters assumed in phases I and II are summarised in Table 1. The time evolution of the model is indicated by the dotted blue arrows.
Current usage metrics show cumulative count of Article Views (full-text article views including HTML views, PDF and ePub downloads, according to the available data) and Abstracts Views on Vision4Press platform.
Data correspond to usage on the plateform after 2015. The current usage metrics is available 48-96 hours after online publication and is updated daily on week days.
Initial download of the metrics may take a while.