Fig. 9.
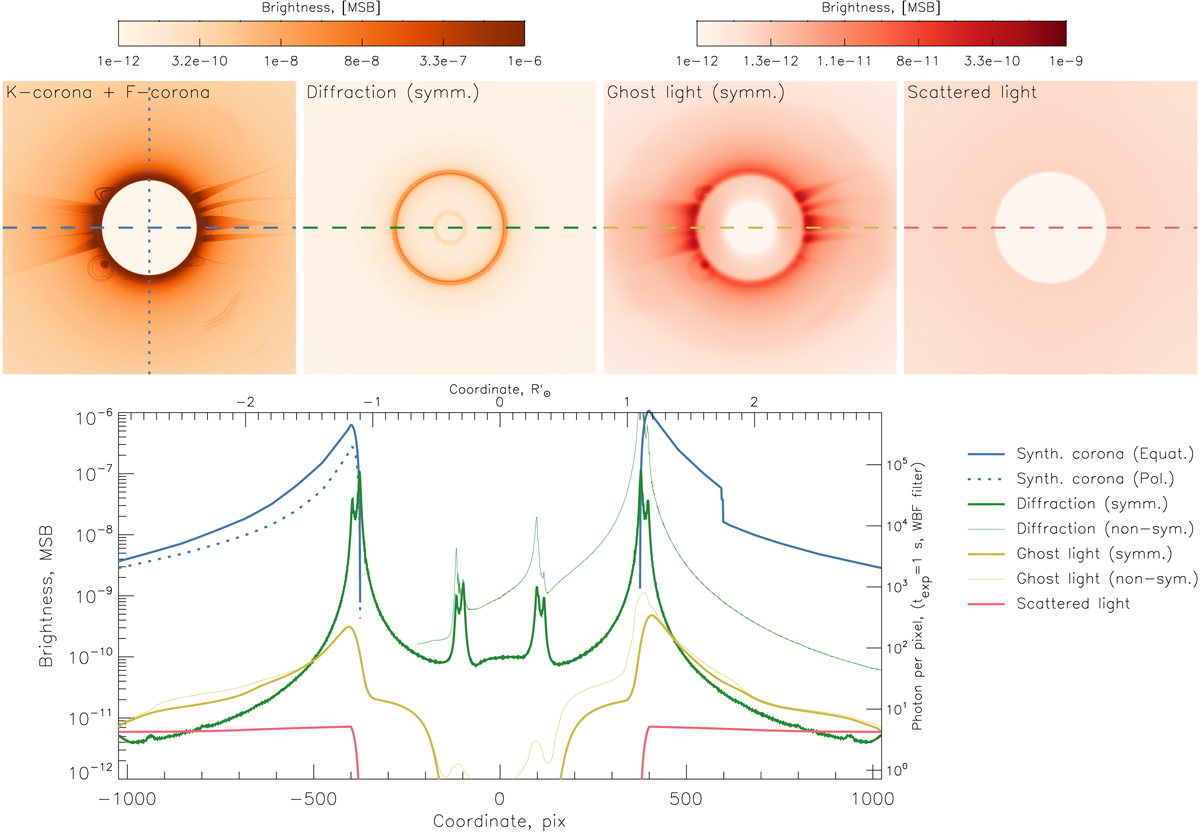
Comparison of different optics-related effects. The images represent the synthetic corona, the diffracted light, the ghost light and the scattered light. The diffracted light is calculated for a symmetrical configuration. The brightness of the images is expressed in MSB, the color scale is the same for coronal and diffraction scenes, and another one for the ghost light and scattered light scenes. Bottom panel: horizontal profiles from the images are denoted by the blue, the green, the yellow, and the red solid lines, correspondingly, while the blue dotted line denotes vertical profile from the coronal scene, which corresponds to the polar corona. The thin green line represents diffraction for the worst non-symmetrical configuration, with both telescope tilt and solar shift (right panel in Fig. 6), the thin yellow line represents the ghost light calculated for this non-symmetrical configuration. The left vertical axis is expressed in MSB, whereas the right axis is expressed in photon per pixel, which is obtained by applying Eq. (1) using texp = 1 s and taking into account MSBW.
Current usage metrics show cumulative count of Article Views (full-text article views including HTML views, PDF and ePub downloads, according to the available data) and Abstracts Views on Vision4Press platform.
Data correspond to usage on the plateform after 2015. The current usage metrics is available 48-96 hours after online publication and is updated daily on week days.
Initial download of the metrics may take a while.