Fig. 5.
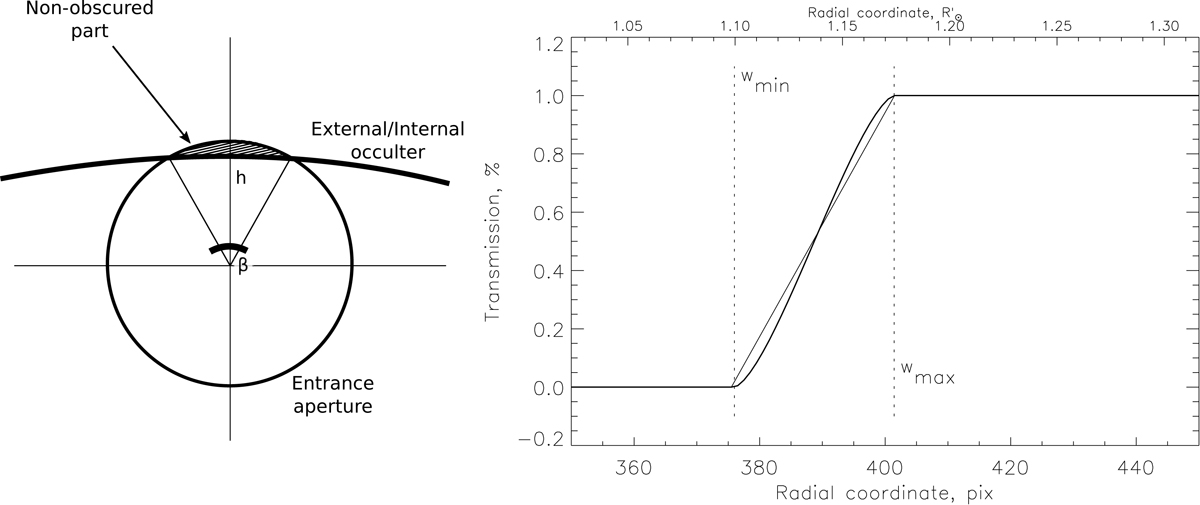
Analysis of the vignetting effect. Left panel: obscuration of the entrance aperture by the internal occulter. Right panel: radial profile of the vignetting function shown with a thick line. The dashed lines denote the minimum wmin and maximum wmax vignetting angles, and the thin line denotes the linear interpolation. The upper scale is expressed in yearly average solar radius for comparison.
Current usage metrics show cumulative count of Article Views (full-text article views including HTML views, PDF and ePub downloads, according to the available data) and Abstracts Views on Vision4Press platform.
Data correspond to usage on the plateform after 2015. The current usage metrics is available 48-96 hours after online publication and is updated daily on week days.
Initial download of the metrics may take a while.