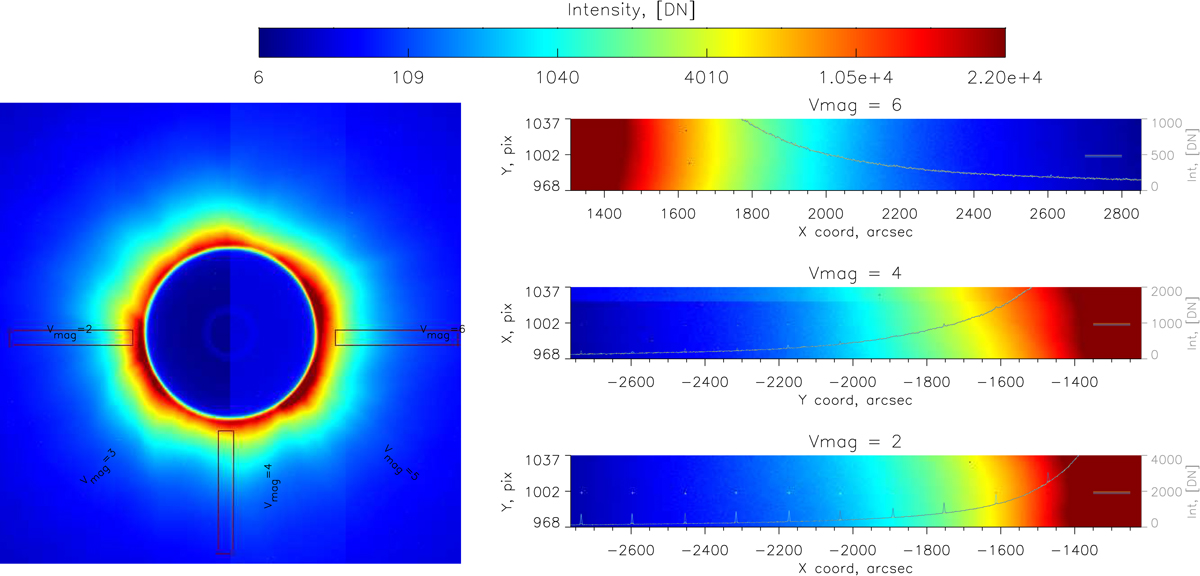
Fig. 16.

Analysis of the star visibility in the ASPIICS images in presence of other sources of light and noises. Left panel: complete simulated image (with the eclipse K corona). Right panels: zoomed regions with stars of magnitude V = 6 (top row), V = 4 (middle row), and V = 2 (bottom). The positions of the zoomed regions with respect to the full image are denoted in the left panel. In the zoomed regions, the main axis denotes coordinates, while the right y-axis denotes the intensity of the profiles, which is shown with a thin line in each zoomed region. The vertical position of the profiles is denoted by corresponding colored lines in the right part of each zoomed region.
Current usage metrics show cumulative count of Article Views (full-text article views including HTML views, PDF and ePub downloads, according to the available data) and Abstracts Views on Vision4Press platform.
Data correspond to usage on the plateform after 2015. The current usage metrics is available 48-96 hours after online publication and is updated daily on week days.
Initial download of the metrics may take a while.


