Fig. 13.
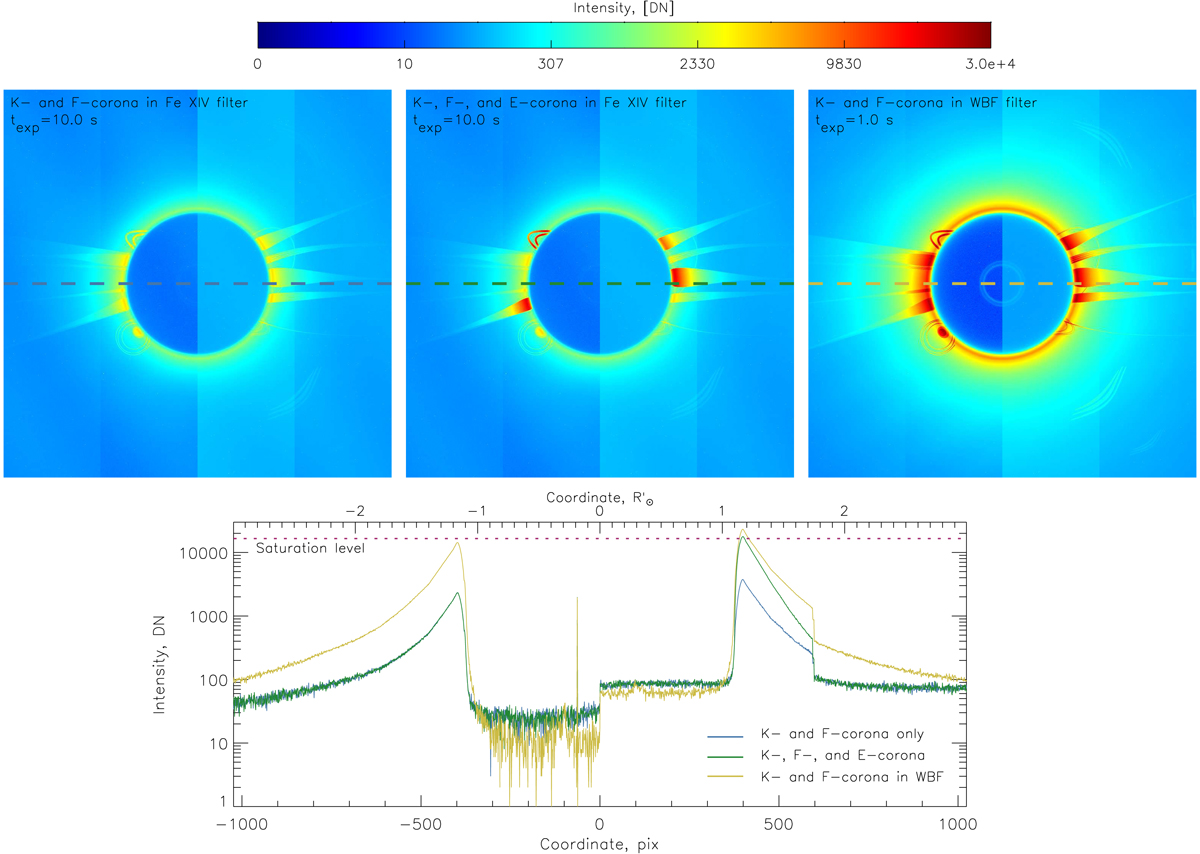
ASPIICS simulated data, generated for the Fe XIV filter and texp = 10.0 s. Left panel: K (synthetic) and F corona alone were used as input. Middle: K, F, and E corona were used as input. Right: WBF image calculated for the K and F corona and texp = 1.0 s (given for reference). Bottom panel: horizontal profiles taken through the center of the images. The color of the lines corresponds to the dashed lines in the images. The logarithmic color scale differs from that in Fig. 12.
Current usage metrics show cumulative count of Article Views (full-text article views including HTML views, PDF and ePub downloads, according to the available data) and Abstracts Views on Vision4Press platform.
Data correspond to usage on the plateform after 2015. The current usage metrics is available 48-96 hours after online publication and is updated daily on week days.
Initial download of the metrics may take a while.